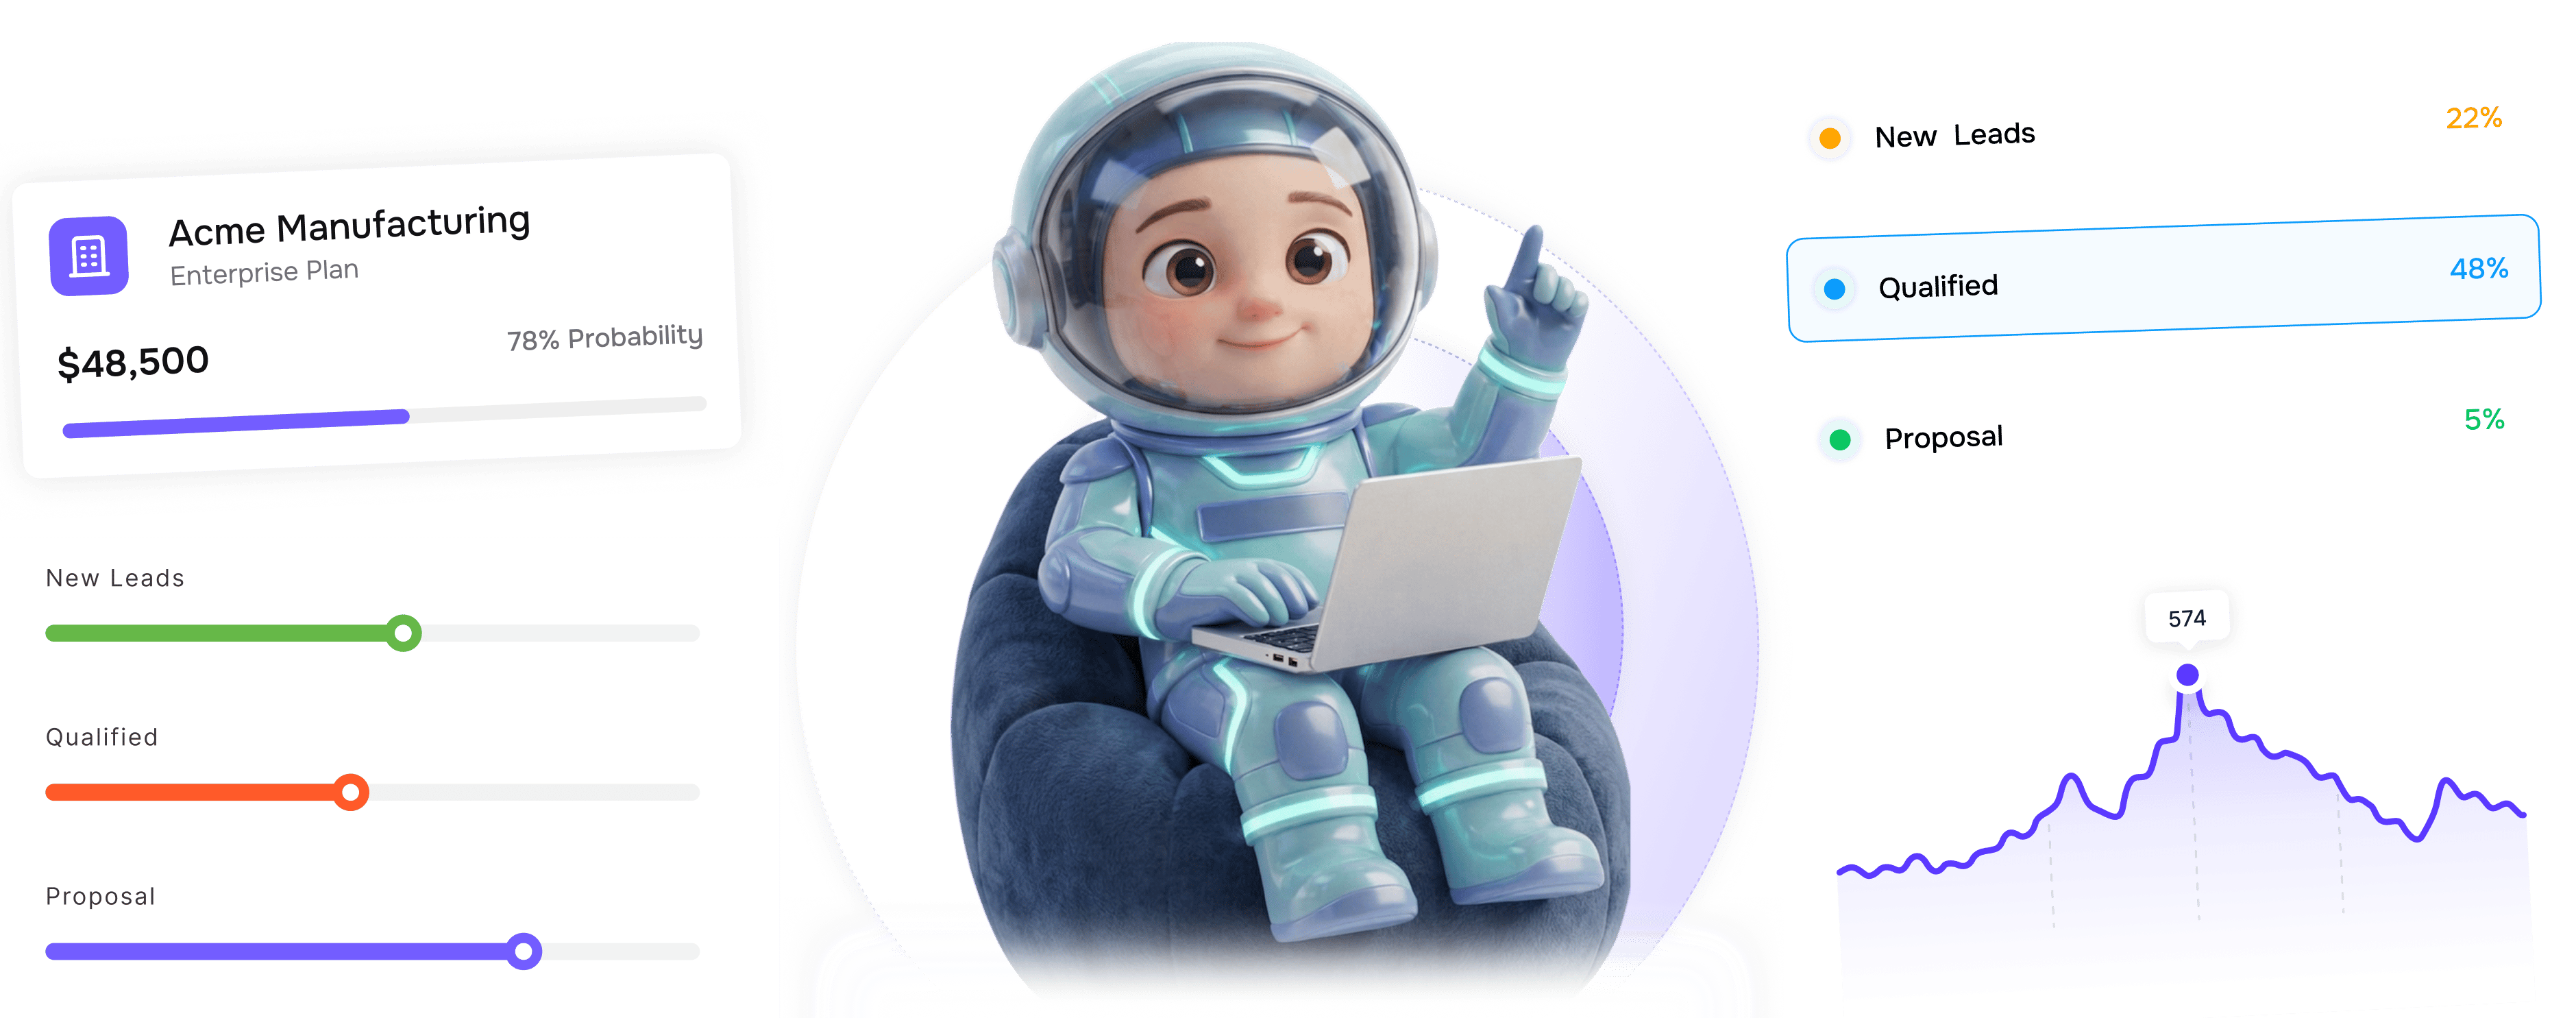
Your entire pipeline visible
in one view.
LIO shows deal progression on interactive boards with drag-and-drop stages, probability weighting, and forecasting.
From interactive boards to strategic forecasting in 4 steps
Create boards, manage stages by drag-and-drop, apply probability weighting, then forecast revenue.
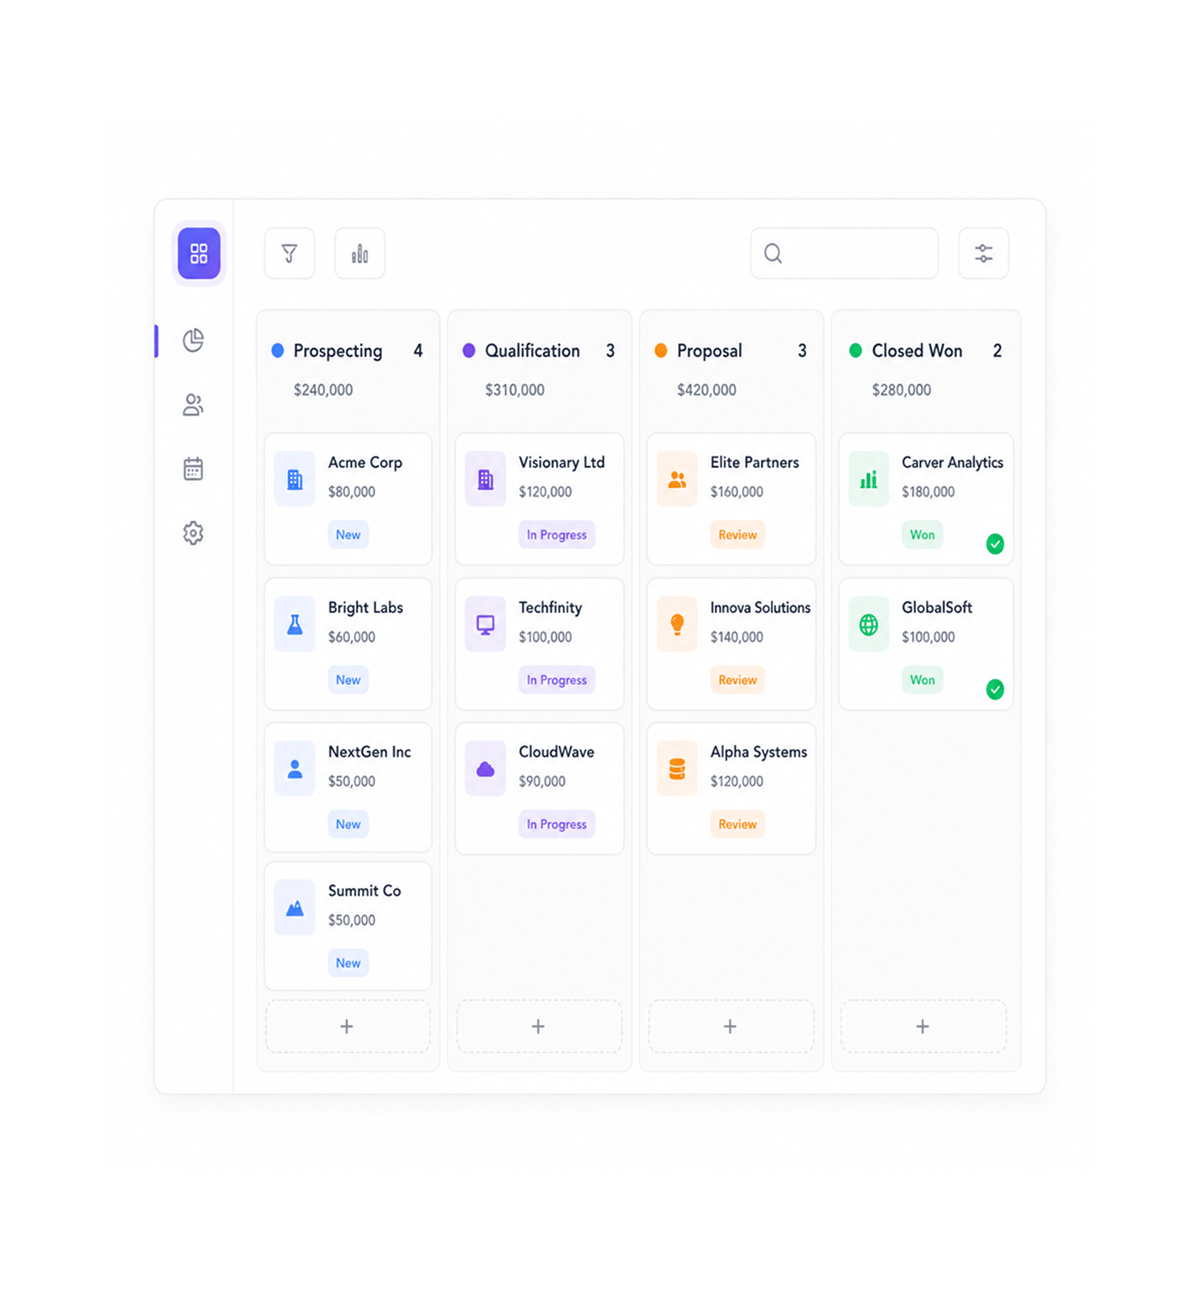
Visual Interface
Create interactive boards
Build interactive boards that display deal progression through visual stage layouts with full deal information and status indicators, enabling intuitive management and clear visibility into performance.
- Interactive Boards
- Visual Stages
- Deal Progression
- Status Indicators
- Clear Visibility
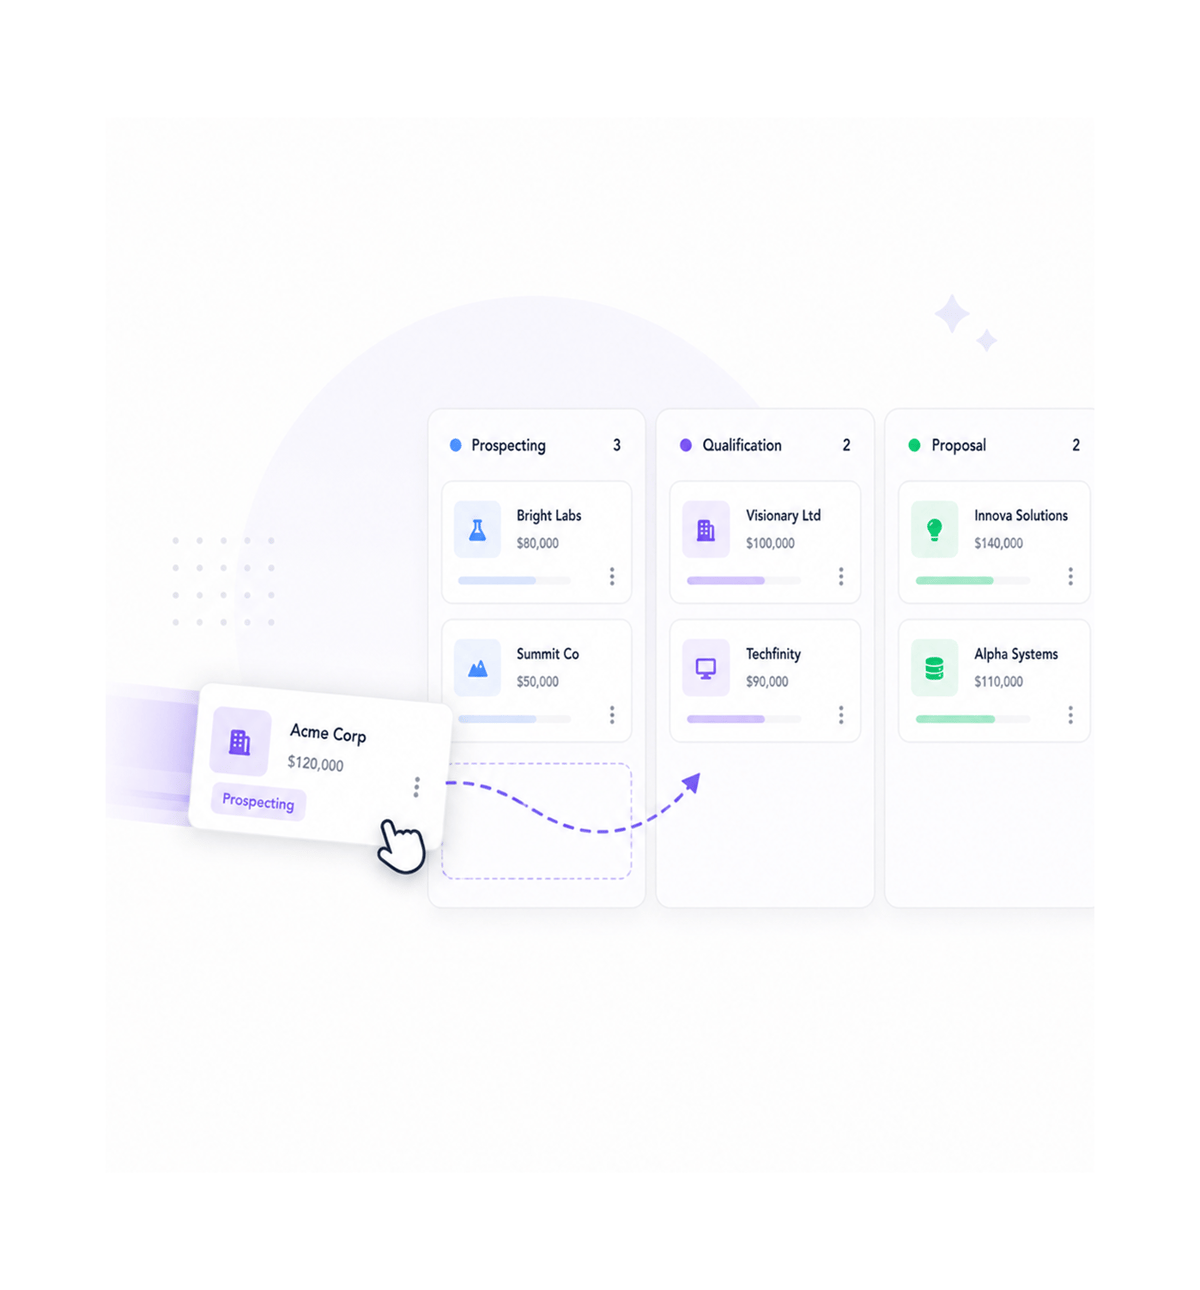
Effortless Management
Implement drag and drop
Enable effortless stage management through intuitive drag-and-drop that allows instant deal movement and stage transitions, streamlining updates while keeping accurate tracking and smooth workflow progression.
- Effortless Movement
- Drag Drop Interface
- Stage Transitions
- Smooth Workflow
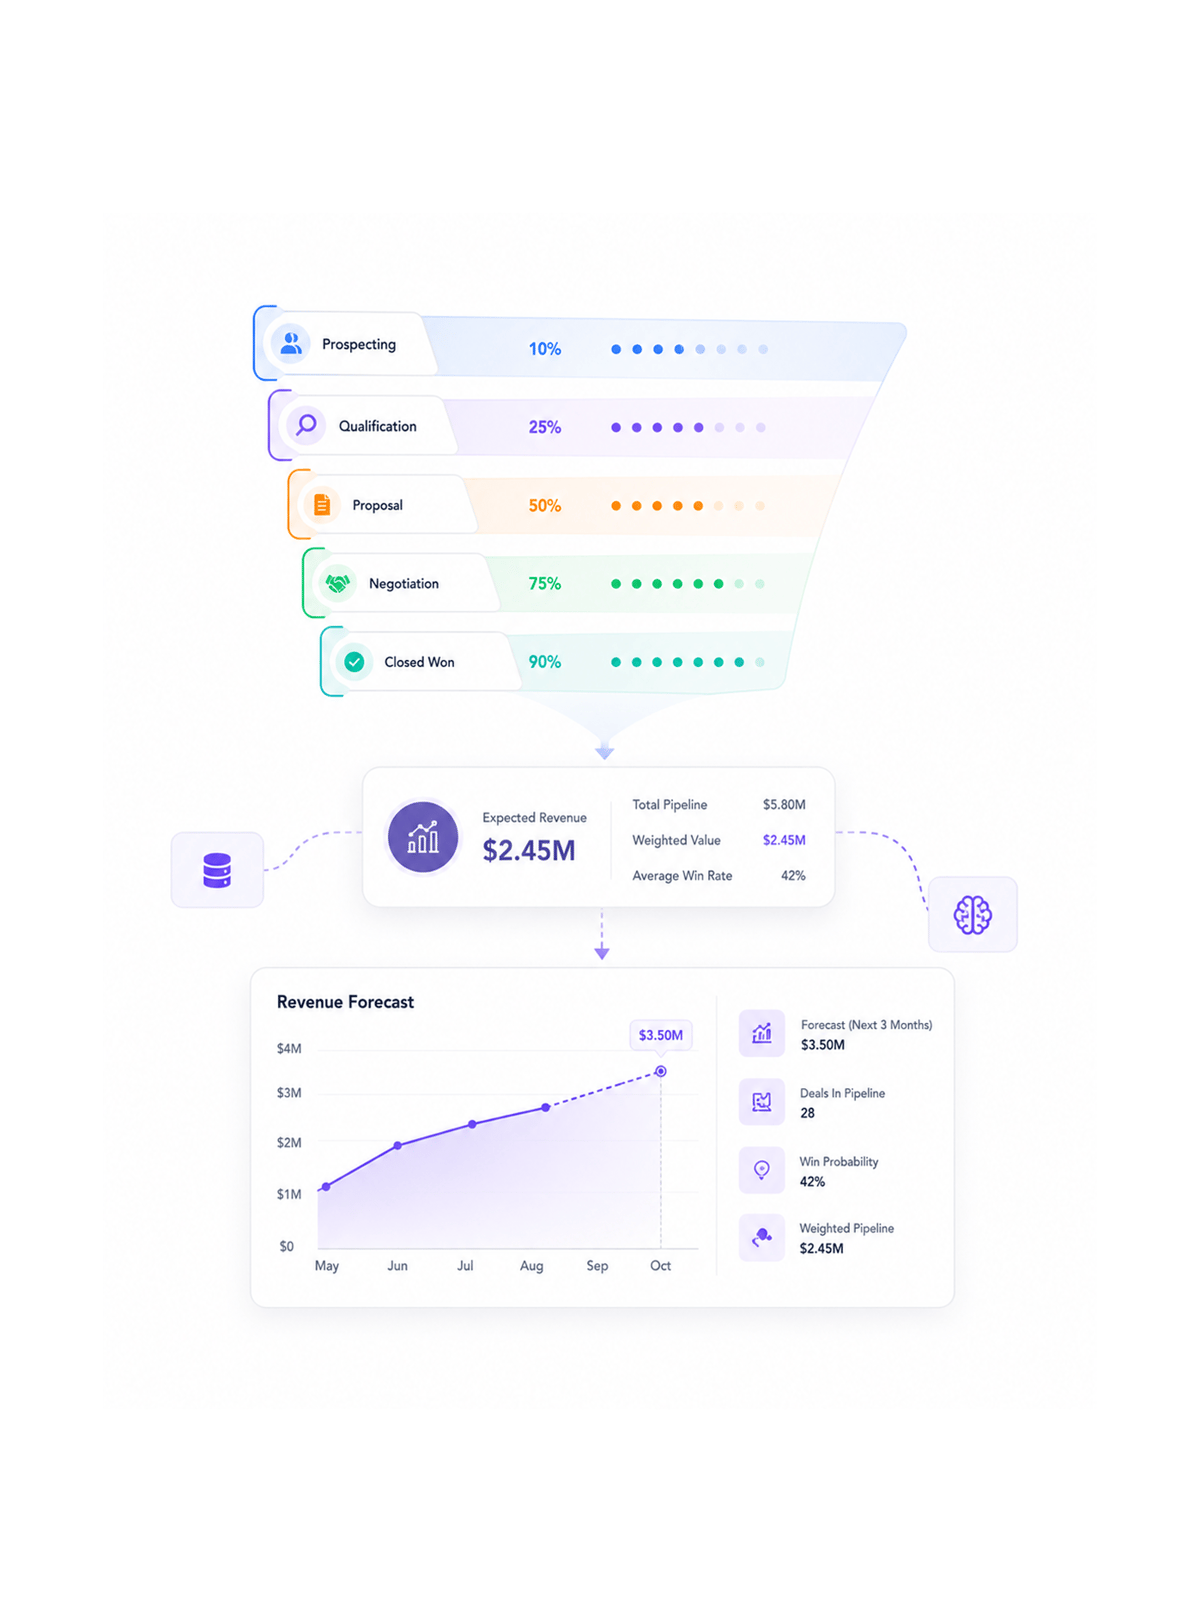
Smart Forecasting
Apply probability weighting
Configure probability weights for each pipeline stage to enable accurate revenue forecasting and realistic predictions, providing data-driven insight into deal likelihood to support strategic decisions.
- Probability Weights
- Accurate Forecasting
- Data Driven Insights
- Predictive Modeling
- Statistical Analysis
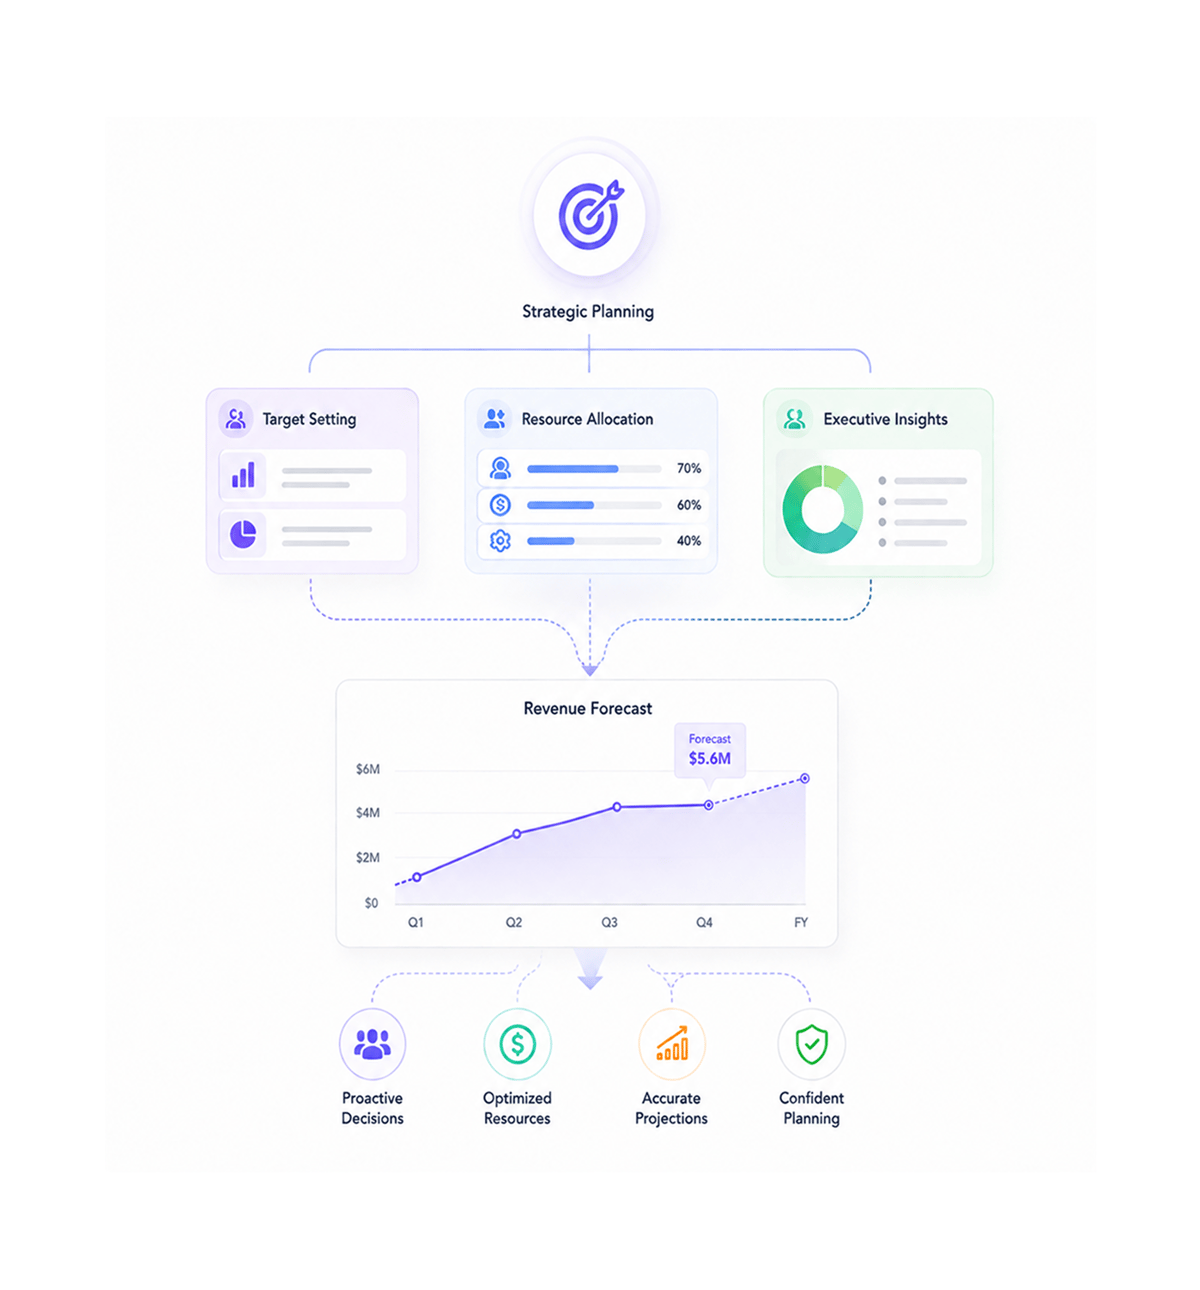
Strategic Planning
Generate revenue forecasts
Create revenue forecasts that support strategic planning and informed decisions based on weighted probability, enabling proactive resource allocation and reliable projections for quarterly and annual cycles.
- Revenue Forecasts
- Strategic Planning
- Resource Allocation
- Executive Insights
Six reasons teams never go back
Once teams use pipeline visualization with drag-and-drop and probability forecasting, static views feel deeply limiting.
Visual Deal Tracking Boards
Monitor deal progression through visual tracking that gives full stage visibility, enabling immediate status recognition and organized oversight.
Stage Predict AI Scoring
Use Stage Predict AI for 0-100 probability scores on advancing to the next stage, enabling deal prioritization and higher conversion rates.
Sign Probability Intelligence
Use Sign Probability AI for 0-100 likelihood scores on deal closure, providing predictive insight while enabling deal prioritization.
Deal Pipeline Integration
Manage deals through systematic deal-pipeline relationships where each deal belongs to a pipeline, ensuring organized management and structure.
Cross Module Deal Coordination
Coordinate deals across all LIO modules through integrated connections to leads, companies, and contacts, providing full deal visibility.
Automated Activity Logging
Track all deal activities through automated logging that captures every action and stage progression, providing full history for analysis.
1800+
visualizing teams
Built for every team that needs visual pipeline intelligence
Sales managers, revenue ops, and leadership all use LIO's pipeline visualization as the shared intelligence layer. The board is visibility, drag-and-drop is simplicity, forecasting makes it strategic.
Pipeline stages supported
Visual clarity guarantee
Forecast accuracy achieved
Drag drop response time
Visualization drives pipeline clarity
Sales teams build interactive boards with drag-and-drop stages and probability weighting for deal monitoring and revenue planning, eliminating confusion while keeping every stage clear.
Built for comprehensive visual intelligence
Everything for visualization: interactive boards, drag-and-drop, probability weighting, forecasting.

JSONB Data Persistence
Store AI probability analysis and pipeline data through JSONB persistence that retains intelligence without re-computation.

Real Time Pipeline Synchronization
Synchronize pipeline updates across all connected clients through SSE and Ably pub/sub for immediate deal visibility.

Pipeline Performance Analytics
Analyze pipeline performance through metrics tracking deal progression, conversion rates, and stage velocity for insight.

Scalable Deal Architecture
Manage high-volume deal operations through scalable architecture that holds performance under enterprise load.

Cross Module Data Integration
Integrate pipeline data with leads, companies, contacts, and activity through cross-module coordination for unified deal visibility.

Multi Language Pipeline Support
Support international teams through multi-language pipeline interfaces with browser detection for consistent global management.
Everything you need to know
Get answers to common questions about LIO's Pipeline Visualization feature.