


Workflow Bottleneck Analysis Before
the Delay Becomes a Deadline.
TARO pinpoints where work stalls: stages with too many in-progress tasks, single points of failure, broken handoffs, then prescribes fixes.
From invisible stall to prescribed fix in four steps
TARO maps every task across your pipeline, classifies each bottleneck by type, and prescribes the exact action to clear it.

Map
TARO maps every task across every stage in real time
TARO builds a live map of your workflow: how many tasks sit at each stage, how long they've been there, the normal WIP limit per stage, and how the current spread compares to baseline. The map updates as tasks move.

Detect
Three types of stall. Each diagnosed differently.
Bottlenecks differ. A stage overload is a capacity problem, a single point of failure a people problem, a broken handoff a process problem. TARO classifies each by type, so the fix targets the root cause, not the symptom.

Prescribe
Not just where it's broken. Exactly how to fix it.
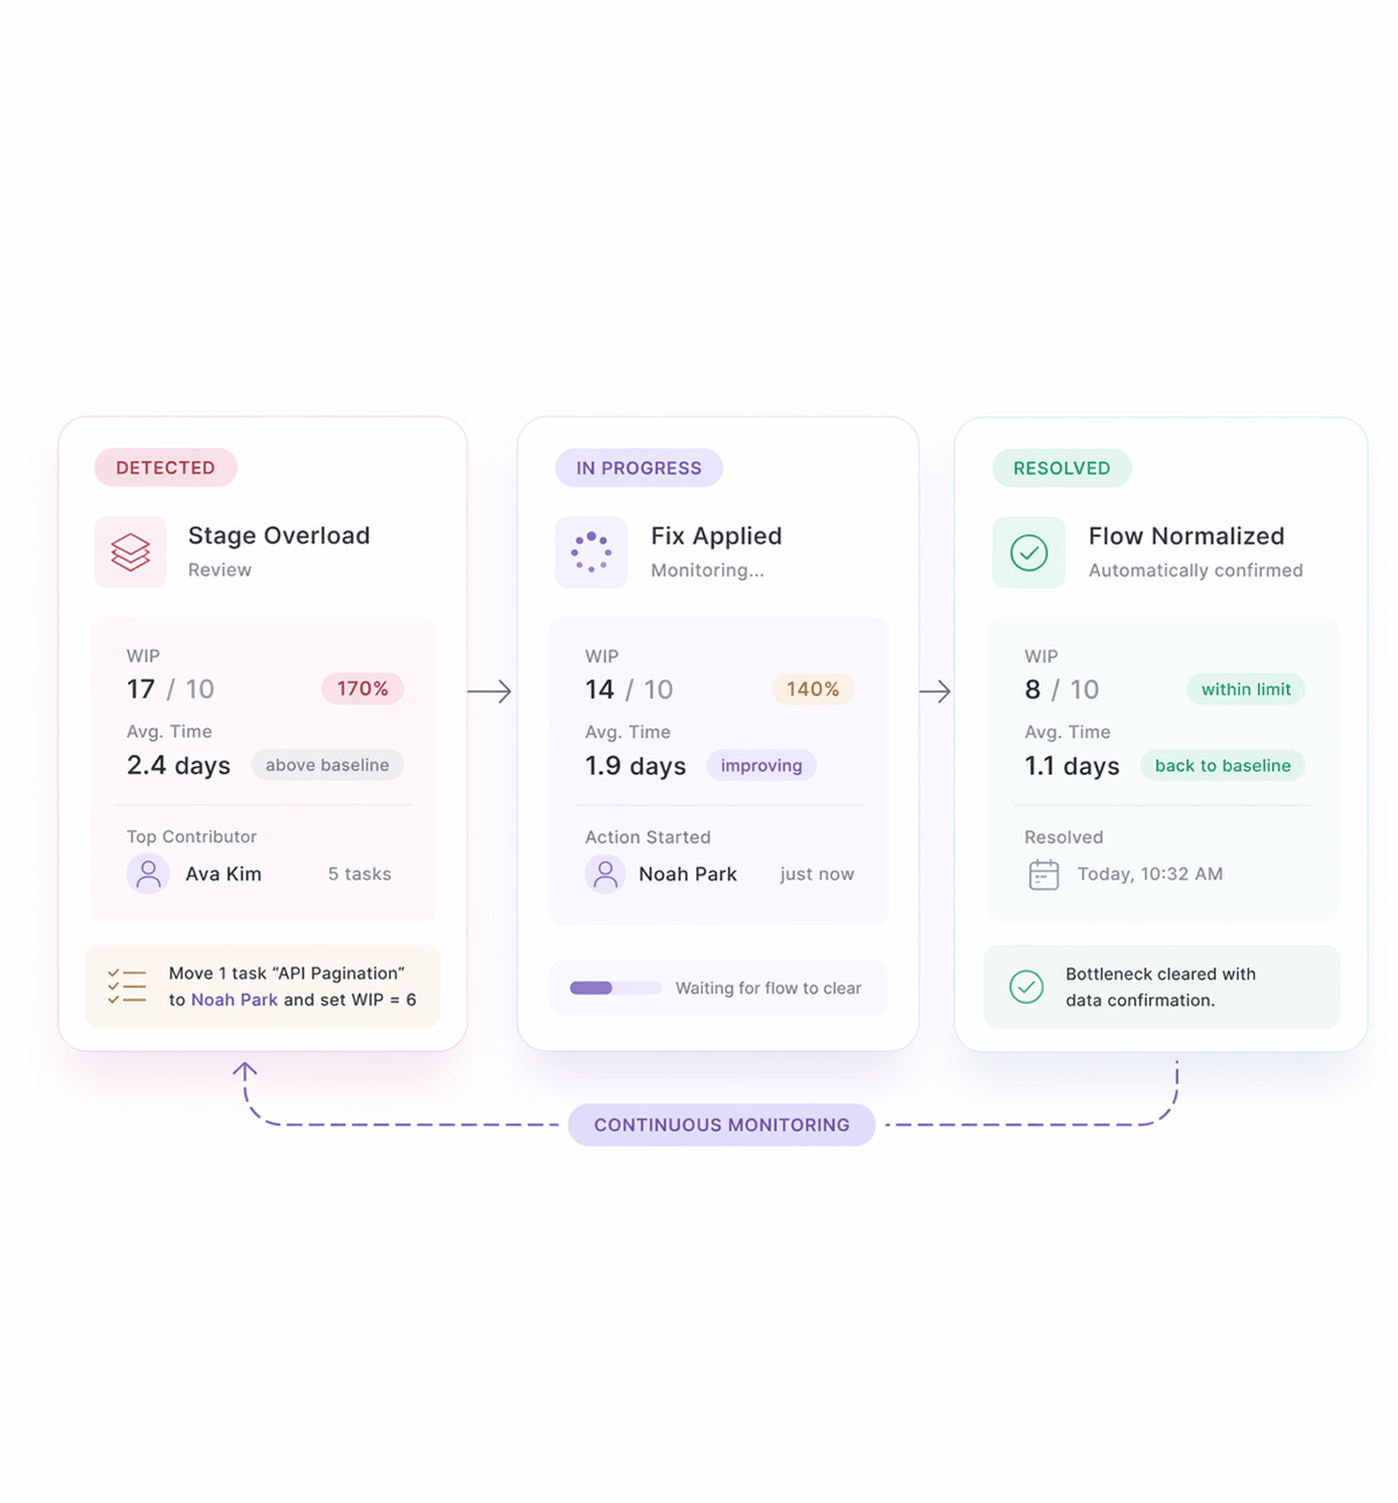
Every bottleneck comes with a specific prescription, not a generic "reduce WIP." TARO names the stage, the person creating the dependency, the exact tasks to move, and each fix's downstream impact so you act first.
Track
Bottlenecks stay on the dashboard until the flow clears
Acting on a prescription marks it in progress, but TARO keeps monitoring the stage. A bottleneck is resolved only when the flow data confirms it: the WIP count drops, the handoff delay returns to baseline, the SPOF is gone.
- Flow confirmed resolution
- Re escalates if it reforms
- Sprint history tracked
Six reasons teams never go back
Sprints that ship on time and ones that miss often look identical on day 5. TARO makes the difference visible on day 2.

Stage overloads visible before the queue buries the sprint
When 14 tasks pile into In Review, the sprint is already in trouble, most teams just can't see it yet. TARO flags the overload the moment it crosses the WIP threshold.

Single points of failure named before they go on leave
Every team has someone who's the only person who can approve, review, or deploy something critical. TARO identifies them and surfaces the risk early.

Broken handoffs caught before they become norms
A handoff that takes 2.4 days when it should take 4 hours is a process failure most teams never measure. TARO compares every transition to your baseline.

Prescriptions target root causes, not symptoms
TARO's prescriptions name the exact stage, person, or transition that's broken and the action to take, not generic advice.

Flow rate recovered, not just acknowledged
TARO tracks the stage's WIP count and handoff time after the prescription is applied, confirming the fix worked from flow data.

Sprint over sprint pattern detection
If In Review stalls the same way every sprint, TARO surfaces the pattern so the fix becomes permanent. Recurring bottlenecks stop once they're visible.


800+
product teams, already using TARO
Built for every team where
slow flow has a real cost
Engineering leads managing delivery and scrum masters running retrospectives need the same insight: where exactly work is getting stuck, and what exactly should change.
Average WIP overflow detected
Bottlenecks cleared within one sprint
Bottleneck types diagnosed
Faster throughput recovery
"Why is everything stuck in review?" gets answered before the standup asks it.
Engineering leads check the bottleneck dashboard each morning. When 14 tasks pile up in In Review and one engineer is sole reviewer on 11, TARO has already named the fix. Standup confirms the action, not the problem.
Bottleneck analysis is just the start
TARO's intelligence covers every dimension of delivery from where work is stalling to when it will finish.

Risk Prediction
Scans for overdue tasks, velocity drops, and blocked dependencies then surfaces exact action recommendations before risks become incidents.

Workload Distribution
Analyzes sprint capacity and suggests exact reassignments to balance overloaded members before a deadline slips with one click to apply.

Completion Analysis
Predicts your project's actual finish date from velocity, blockers, and sprint history. Predicted date, variance, and confidence before you commit.

Smart Task Creation
Type one sentence. TARO generates a fully structured task title, description, priority, due date, assignee in under 3 seconds. No forms, no clicks.
Everything you need to know about Bottleneck Analysis
Common questions from engineering leads, scrum masters, and PMs evaluating TARO's flow analysis.
TARO derives WIP limits from two sources. First, historical throughput: how many tasks your team processes through each stage per day over the last 4 to 8 sprints. A stage averaging 4 completions per day implies a WIP limit of roughly 4 to 6. Second, configurable team-defined limits: admins can set explicit per-stage caps (e.g. "In Review: max 6"). When a stage's task count exceeds either threshold by more than 20%, TARO flags an overload, showing both the current count and the calculated limit.