Live execution status with progress indicators for every running workflow. Complete step by step logs of everything that happened. Error messages with full diagnostic detail when something fails. Execution duration captured per step so you can find the bottleneck. A visual timeline of every run from trigger to completion. A workflow automation platform where visibility is the default, not a feature you bolt on after something already went wrong.
Watch every workflow run live with progress indicators that show exactly which step is executing right now. Read the step by step log to see what happened in order with the full context every step produced. Diagnose errors with the complete diagnostic detail surfaced inline. Profile the whole run on a visual timeline that makes durations and bottlenecks obvious at a glance.
Live Status
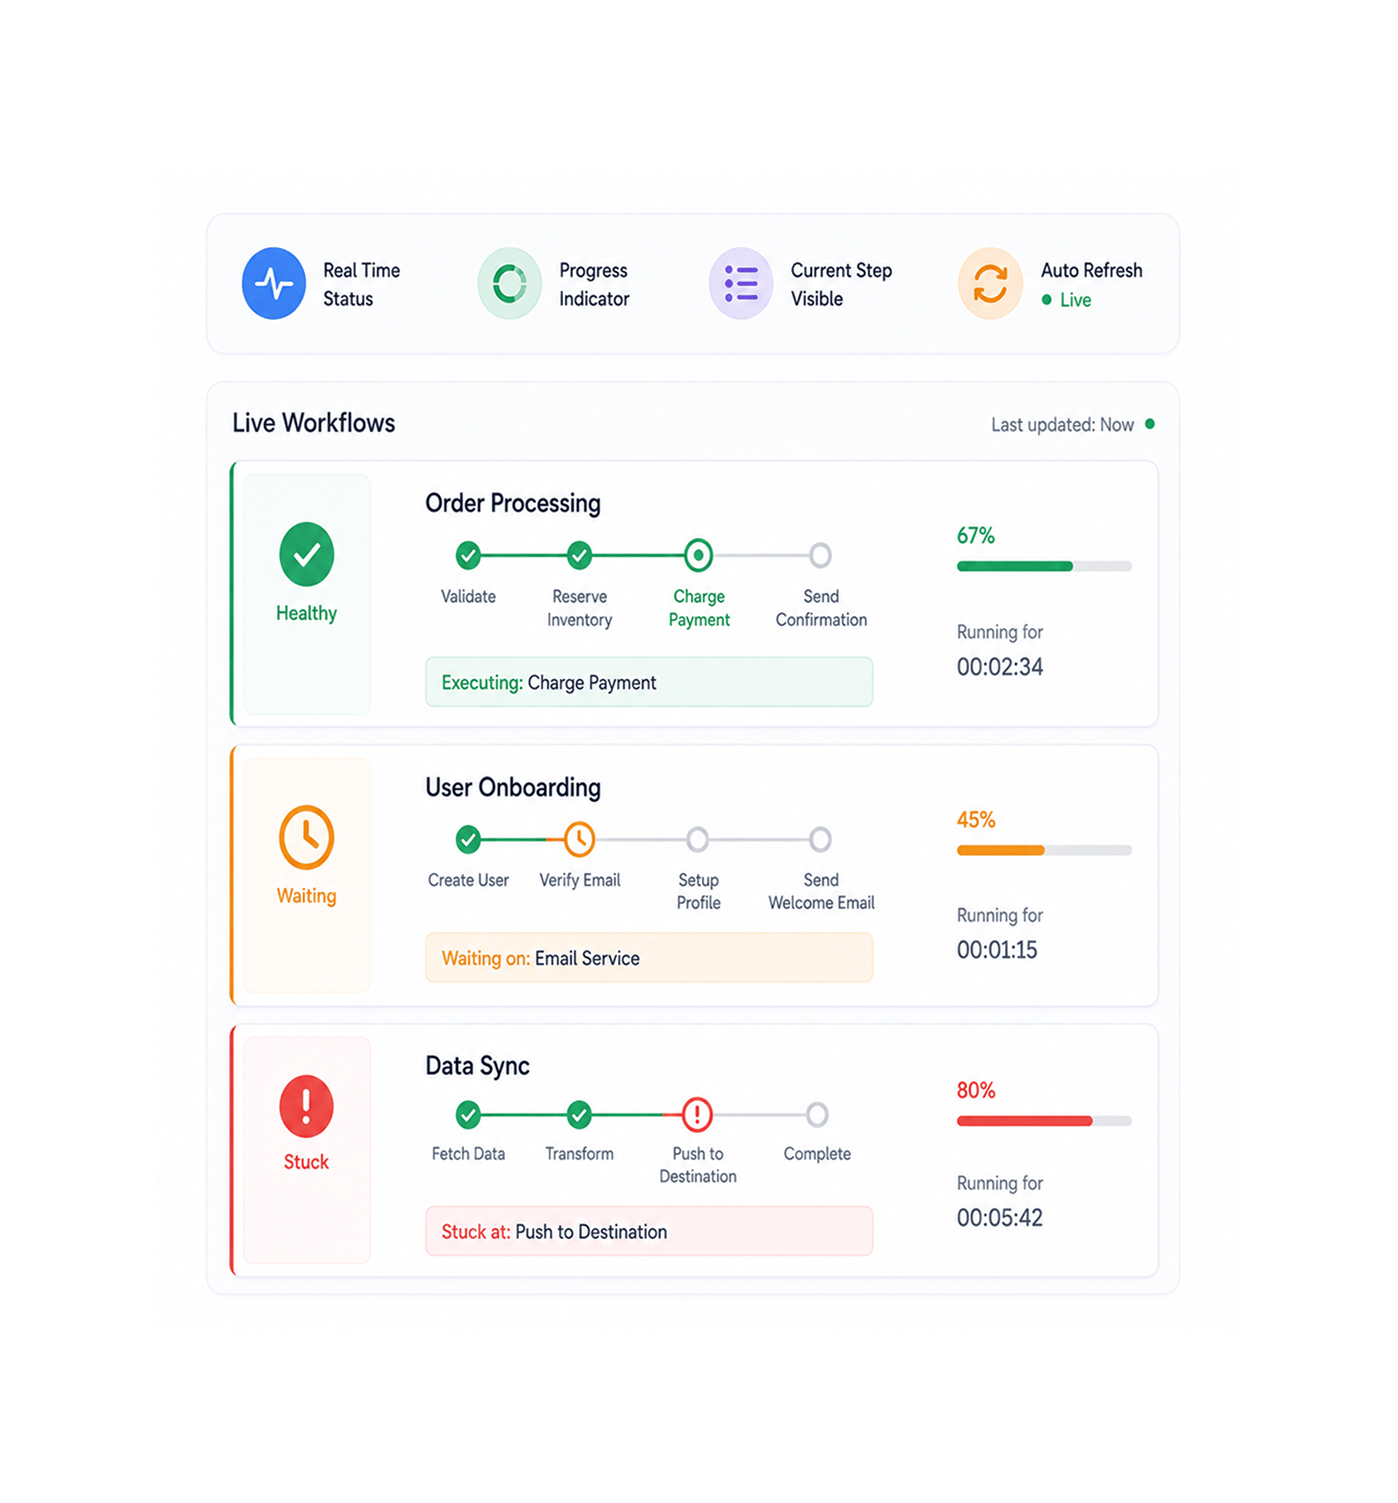
Open the execution view and every running workflow appears with a real time progress indicator showing which step is executing right now, how far through the workflow it is, and how long it has been running. The team can see at a glance which workflows are healthy, which ones are waiting on an external service, and which ones are stuck somewhere they should not be without refreshing the page or guessing from indirect signals.
Step by Step Logs
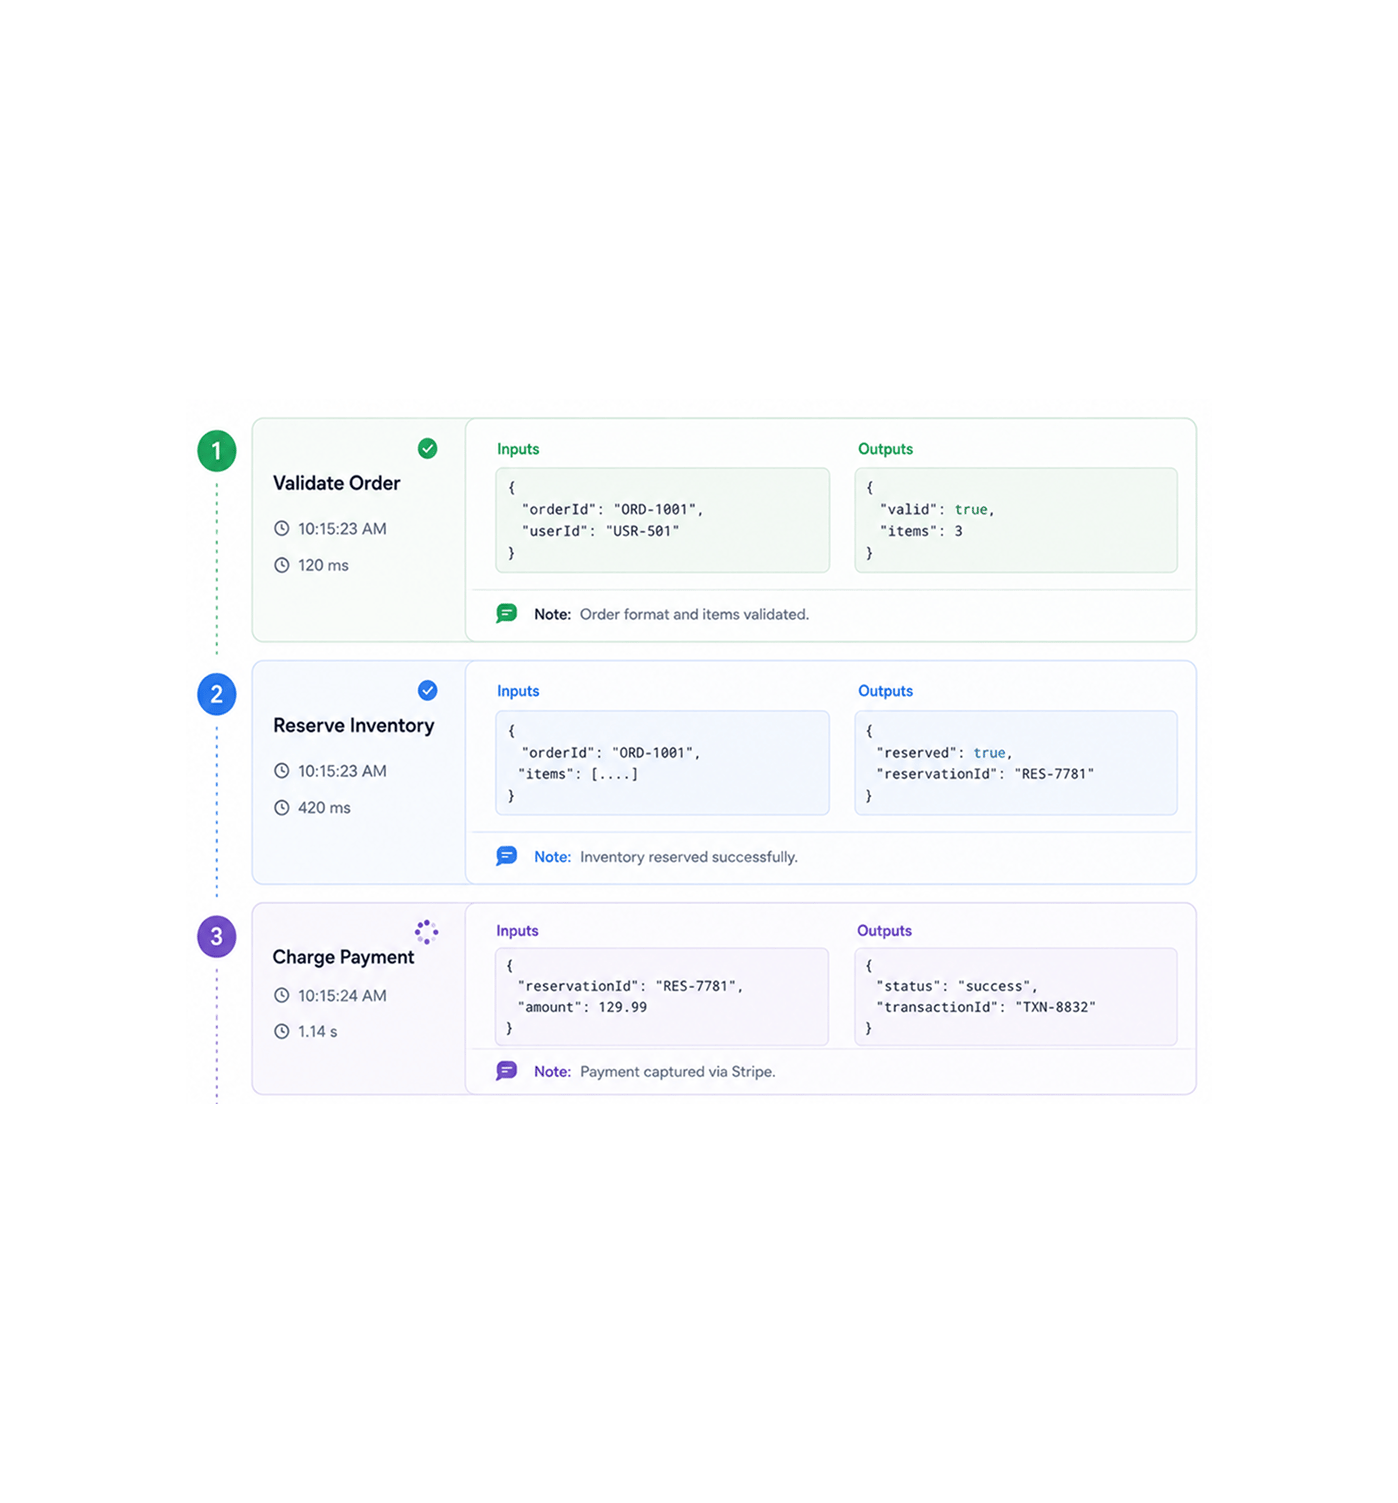
Click into any run and the full step by step log opens with every step that executed, the inputs each one received, the outputs each one produced, the timing of every operation, and any notes the workflow captured along the way. The log reads top to bottom in execution order, so reconstructing what happened during the run becomes a matter of reading rather than detective work across multiple systems.
Error Diagnostics
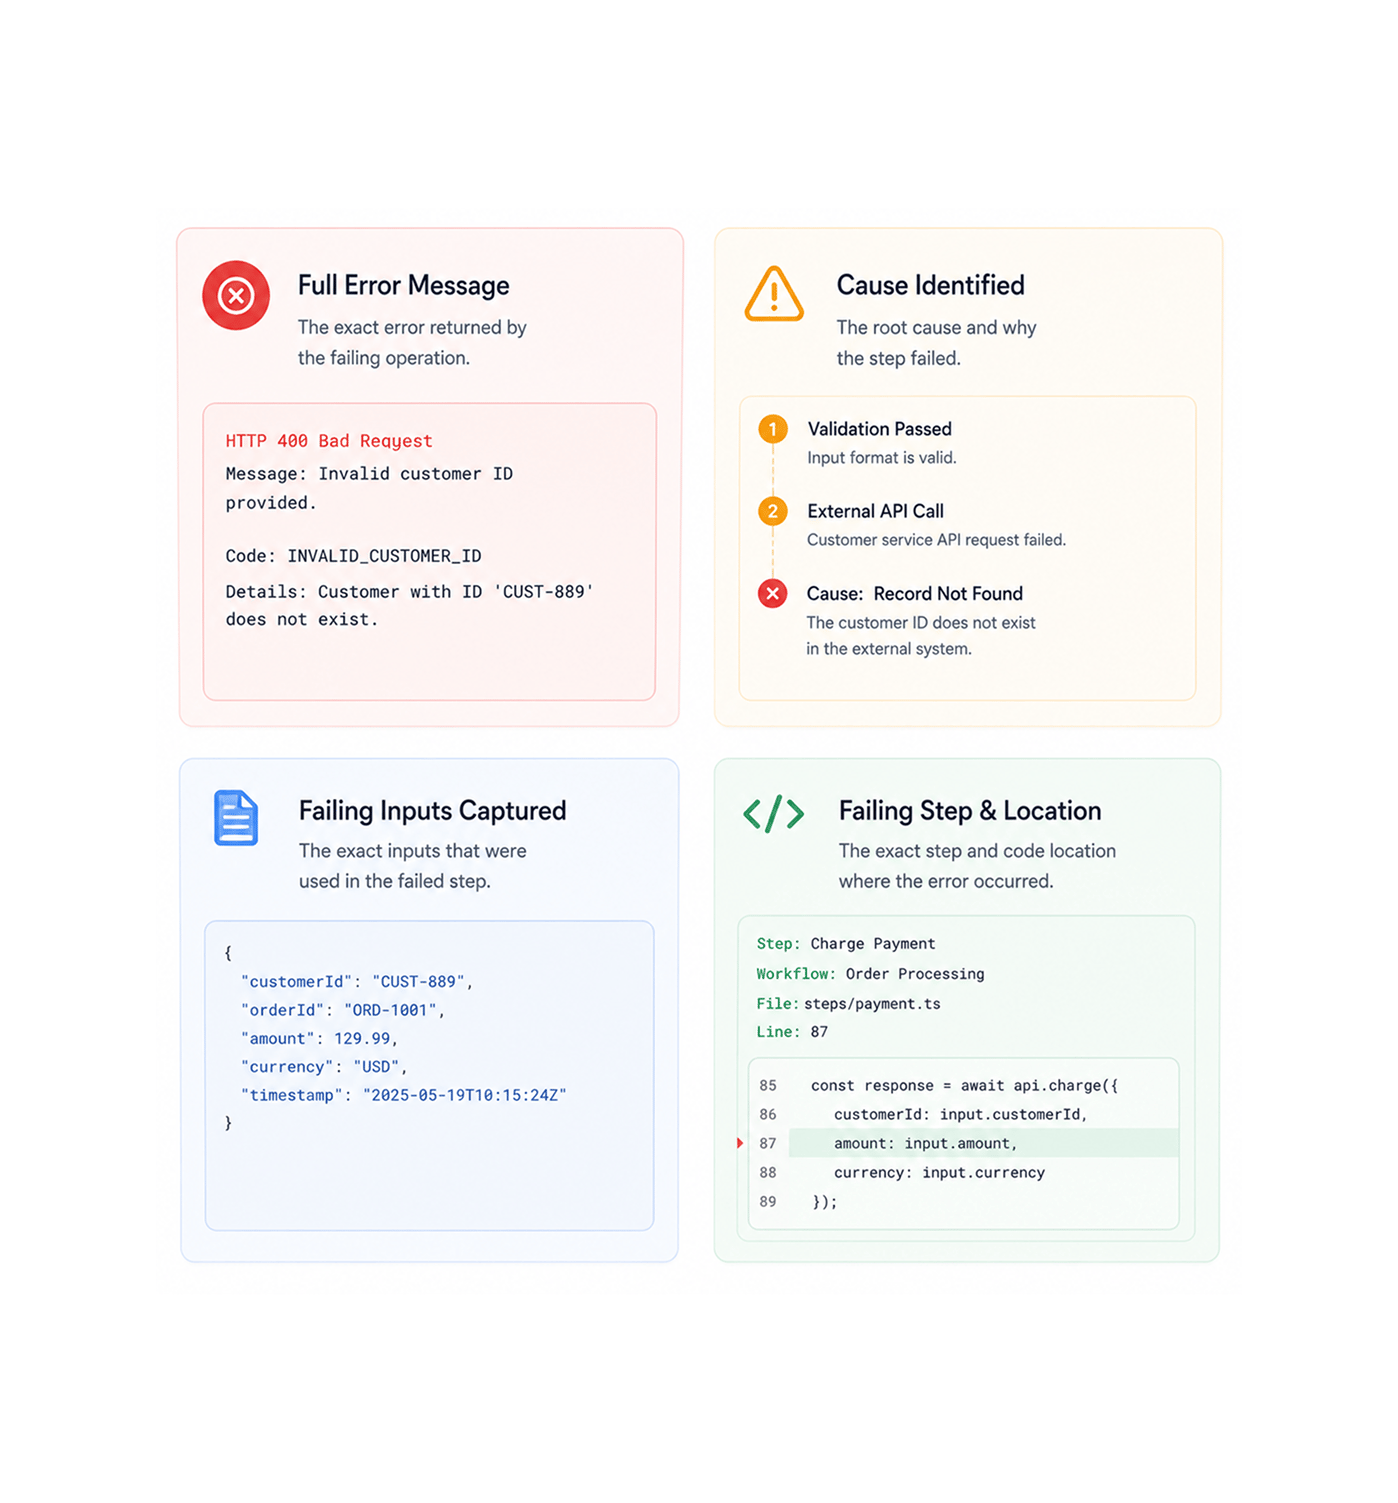
When a step fails, the error appears in the log with the full diagnostic detail the message that came back from the failing operation, the cause of the failure, the exact step that failed, the input values that produced it, and the line where the problem occurred. The vague "something went wrong" experience that used to send the team digging through three different tools collapses to a single expandable error panel right in the execution view.
Visual Timeline
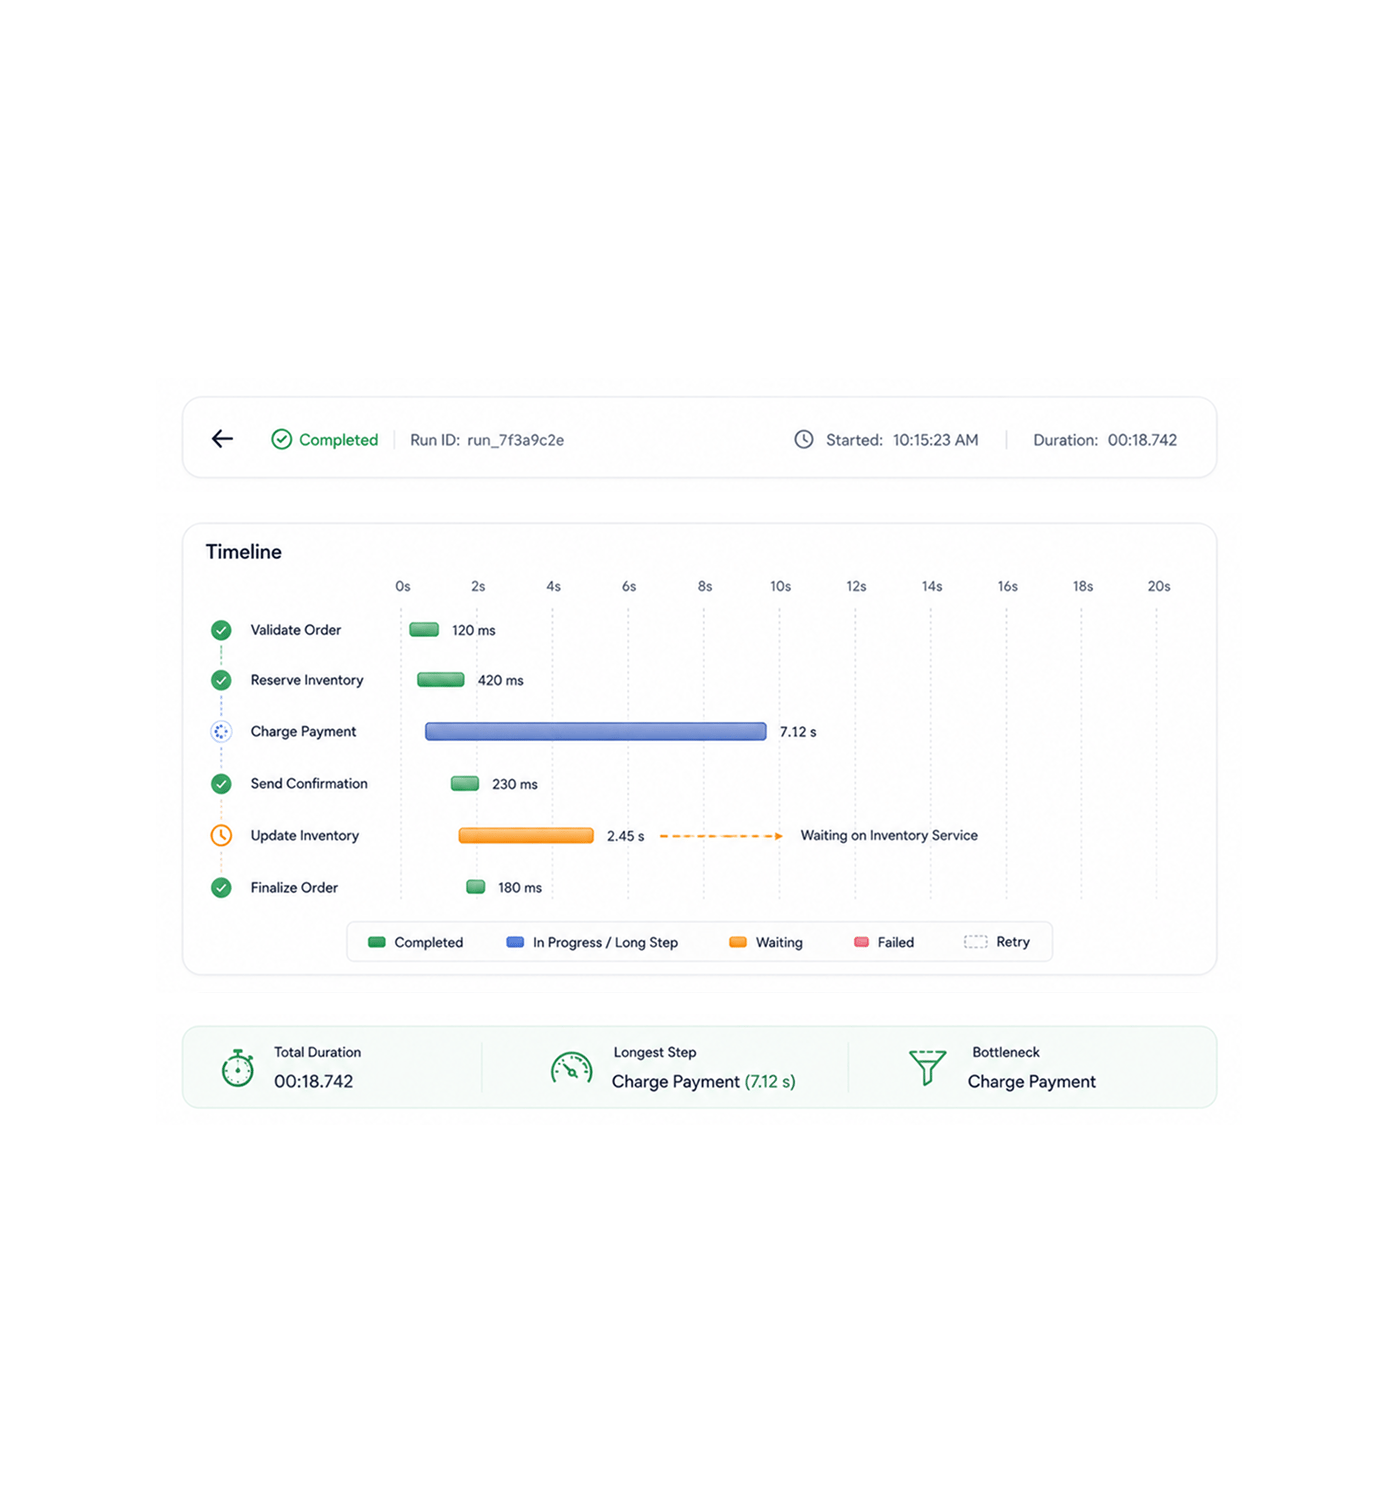
Every run has a visual timeline that shows each step as a horizontal bar with its duration, position in the workflow, and any retries or waits along the way. The step that takes seven seconds when every other step takes a hundred milliseconds becomes immediately obvious. Finding the bottleneck stops being a hunch and starts being a glance which is what the people automating at scale need to keep the whole system healthy.
Once a team can see every workflow run as it happens with live status, full step logs, complete error detail, and a visual timeline the old pattern of finding out something is wrong because a customer complained, then digging through three different systems to reconstruct what happened, stops being acceptable. These are the changes that show up first.
Live status with progress indicators means the team knows exactly what is happening across every running workflow at any moment. The unsettling experience of waiting for a workflow to finish and not knowing whether it is healthy, stuck, or already failed simply ends. Every run shows its current step, its progress, and its elapsed time in real time, so confidence in the automation stops requiring an act of faith.
Failed steps surface the full diagnostic detail right in the execution view the message, the cause, the inputs that produced it, the exact location of the failure. The "something went wrong, good luck figuring out what" experience that used to send the team chasing logs across three different tools collapses to a single expandable panel with everything needed to understand and fix the problem.
The visual timeline makes the slow step in a workflow as visible as a long bar next to a row of short ones. The performance problem that used to require somebody to add manual timing instrumentation and rerun the workflow ten times shows up in the first run on the timeline. Optimisation becomes a targeted exercise rather than a guessing game across the whole workflow.
The step by step log captures every input, every output, every decision, every retry not just the final outcome of the workflow. The customer question "why did this specific run send the wrong email on Tuesday" gets answered by reading the actual run rather than guessing from outside signals. The audit story your business has been asking for stops being a separate compliance project and becomes a side effect of how the platform works.
The execution history is searchable by workflow name, by trigger source, by status, by date range, by error type, by any field in the input or output of any step. Finding the run from last Tuesday that handled the lead from a specific company becomes a search across one place instead of a hunt through three. The team's debugging time shrinks dramatically because the platform makes the right answer findable.
Side by side comparison of two runs makes the difference between a successful execution and a failing one immediately visible the input that changed, the step that branched differently, the duration that grew, the error that appeared. The "what changed" question that used to require an engineer to manually diff two runs becomes a built in view, which means the regression nobody quite understands gets solved in minutes rather than hours.
Live execution status. Step by step logs. Full error diagnostics. Per step timing. Visual timeline of every run. The visibility layer your automation has always needed.
11200+
Teams running workflows with full
execution visibility
Operations leaders, platform teams, automation engineers, customer success managers responding to "what happened with my record" questions, finance specialists running regulated workflows, and engineering teams maintaining mission critical automations all use Revo execution monitoring as the single window into every workflow run. The live status surface is the real time view. The step by step log is the deep dive. The error diagnostics are the debugging tool. The visual timeline is the performance lens. Every team a small business running a handful of workflows or a larger organisation orchestrating hundreds of business process automations across the full stack gets the same complete visibility into every run.
Status
Logs
Timing
Timeline
Live execution status with progress indicators for every running workflow. See which step is executing right now, how far through the workflow it is, and how long it has been running. The team always knows what is healthy, what is waiting, and what needs attention without refreshing pages or guessing from indirect signals.
A complete visibility toolkit built into the same workflow automation platform your team already uses. Live execution status, step by step logs, error diagnostics, per step timing, visual timeline, and a searchable run history come together so the team always knows exactly what every workflow is doing right now and what every workflow did before.
Every running workflow shows its current step, its progress through the workflow, its elapsed time, and its health status in real time. The execution view auto refreshes as steps complete, so the team always has the freshest picture of what is happening across every automation without manual page refreshes or polling.
Every run keeps a complete log of every step that executed, the inputs each step received, the outputs each step produced, the timing of every operation, and any inline notes the workflow captured. The log reads top to bottom in execution order, so understanding any run becomes a matter of reading rather than reconstructing from indirect evidence.
Failed steps surface the full error context the message, the cause, the inputs that produced it, the exact location of the failure, and the complete stack trace when available. The vague "something went wrong" experience that used to require digging through external logs collapses to a single expandable panel with everything needed to understand and fix the problem.
Every step's duration is captured automatically, from the moment it started to the moment it finished, including any waits, retries, or external service round trips. The step that takes seven seconds when every other step takes a hundred milliseconds is impossible to miss, which makes finding the bottleneck a glance rather than a guessing game.
Every run gets a visual timeline that shows each step as a horizontal bar with its duration, position in the workflow, and any retries or waits along the way. Slow steps stand out instantly. Parallel branches show side by side. The whole shape of the workflow execution becomes visible at a glance instead of buried in a list of timestamps.
The complete history of every run is searchable by workflow name, trigger source, status, date range, error type, and any field in the inputs or outputs of any step. Finding the specific run from last Tuesday that handled the lead from a particular company becomes a search across one place instead of a hunt through three different tools.
Every running workflow shows its current step, its progress through the workflow, its elapsed time, and its health status in real time. The execution view auto refreshes as steps complete, so the team always has the freshest picture of what is happening across every automation without manual page refreshes or polling.
Every run keeps a complete log of every step that executed, the inputs each step received, the outputs each step produced, the timing of every operation, and any inline notes the workflow captured. The log reads top to bottom in execution order, so understanding any run becomes a matter of reading rather than reconstructing from indirect evidence.
Failed steps surface the full error context the message, the cause, the inputs that produced it, the exact location of the failure, and the complete stack trace when available. The vague "something went wrong" experience that used to require digging through external logs collapses to a single expandable panel with everything needed to understand and fix the problem.
Every step's duration is captured automatically, from the moment it started to the moment it finished, including any waits, retries, or external service round trips. The step that takes seven seconds when every other step takes a hundred milliseconds is impossible to miss, which makes finding the bottleneck a glance rather than a guessing game.
Every run gets a visual timeline that shows each step as a horizontal bar with its duration, position in the workflow, and any retries or waits along the way. Slow steps stand out instantly. Parallel branches show side by side. The whole shape of the workflow execution becomes visible at a glance instead of buried in a list of timestamps.
The complete history of every run is searchable by workflow name, trigger source, status, date range, error type, and any field in the inputs or outputs of any step. Finding the specific run from last Tuesday that handled the lead from a particular company becomes a search across one place instead of a hunt through three different tools.
Common questions about what the live status surface shows, what gets captured in the step by step logs, how error diagnostics work in practice including stack traces, how the visual timeline helps find performance bottlenecks, how long execution history is retained, and how monitoring integrates with alerting and notifications.
The live status surface shows every currently running workflow with its real time state which step is executing right now, how far through the workflow the run has progressed, how long it has been running, and a health indicator that flags anything looking unhealthy. The view auto refreshes as steps complete, so the team always sees the freshest picture without refreshing the page manually. Filter by workflow, by status, by trigger source, or by any combination to focus on exactly the executions that matter at the moment.
Live execution status. Step by step logs. Full error diagnostics. Per step timing. Visual timeline. Searchable history. The visibility layer your automation has always needed.