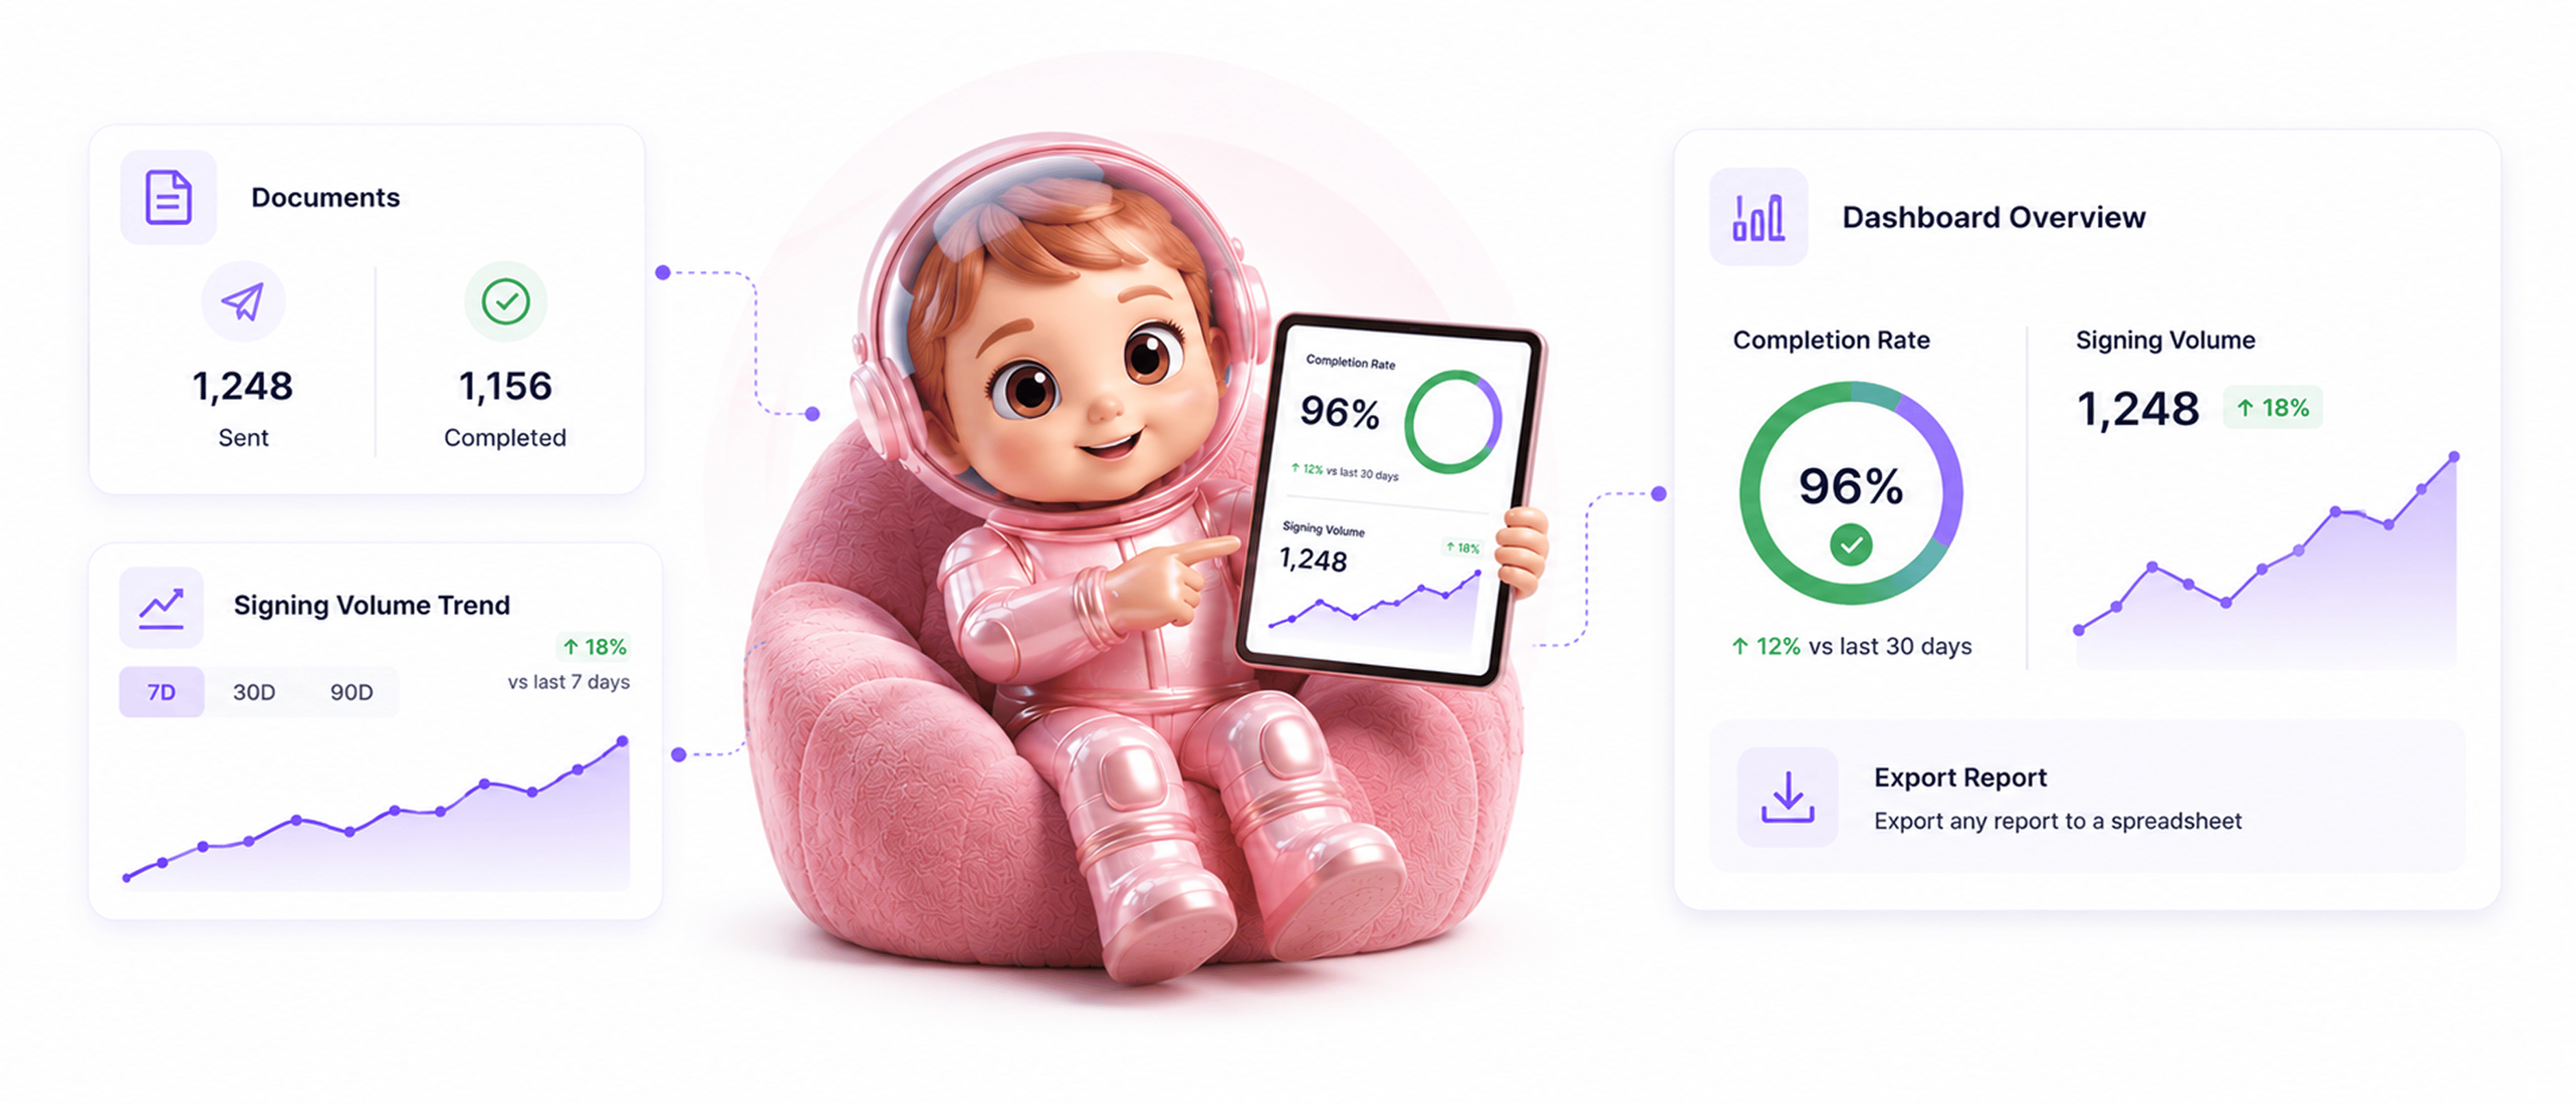
Every signing metric.
In one dashboard.
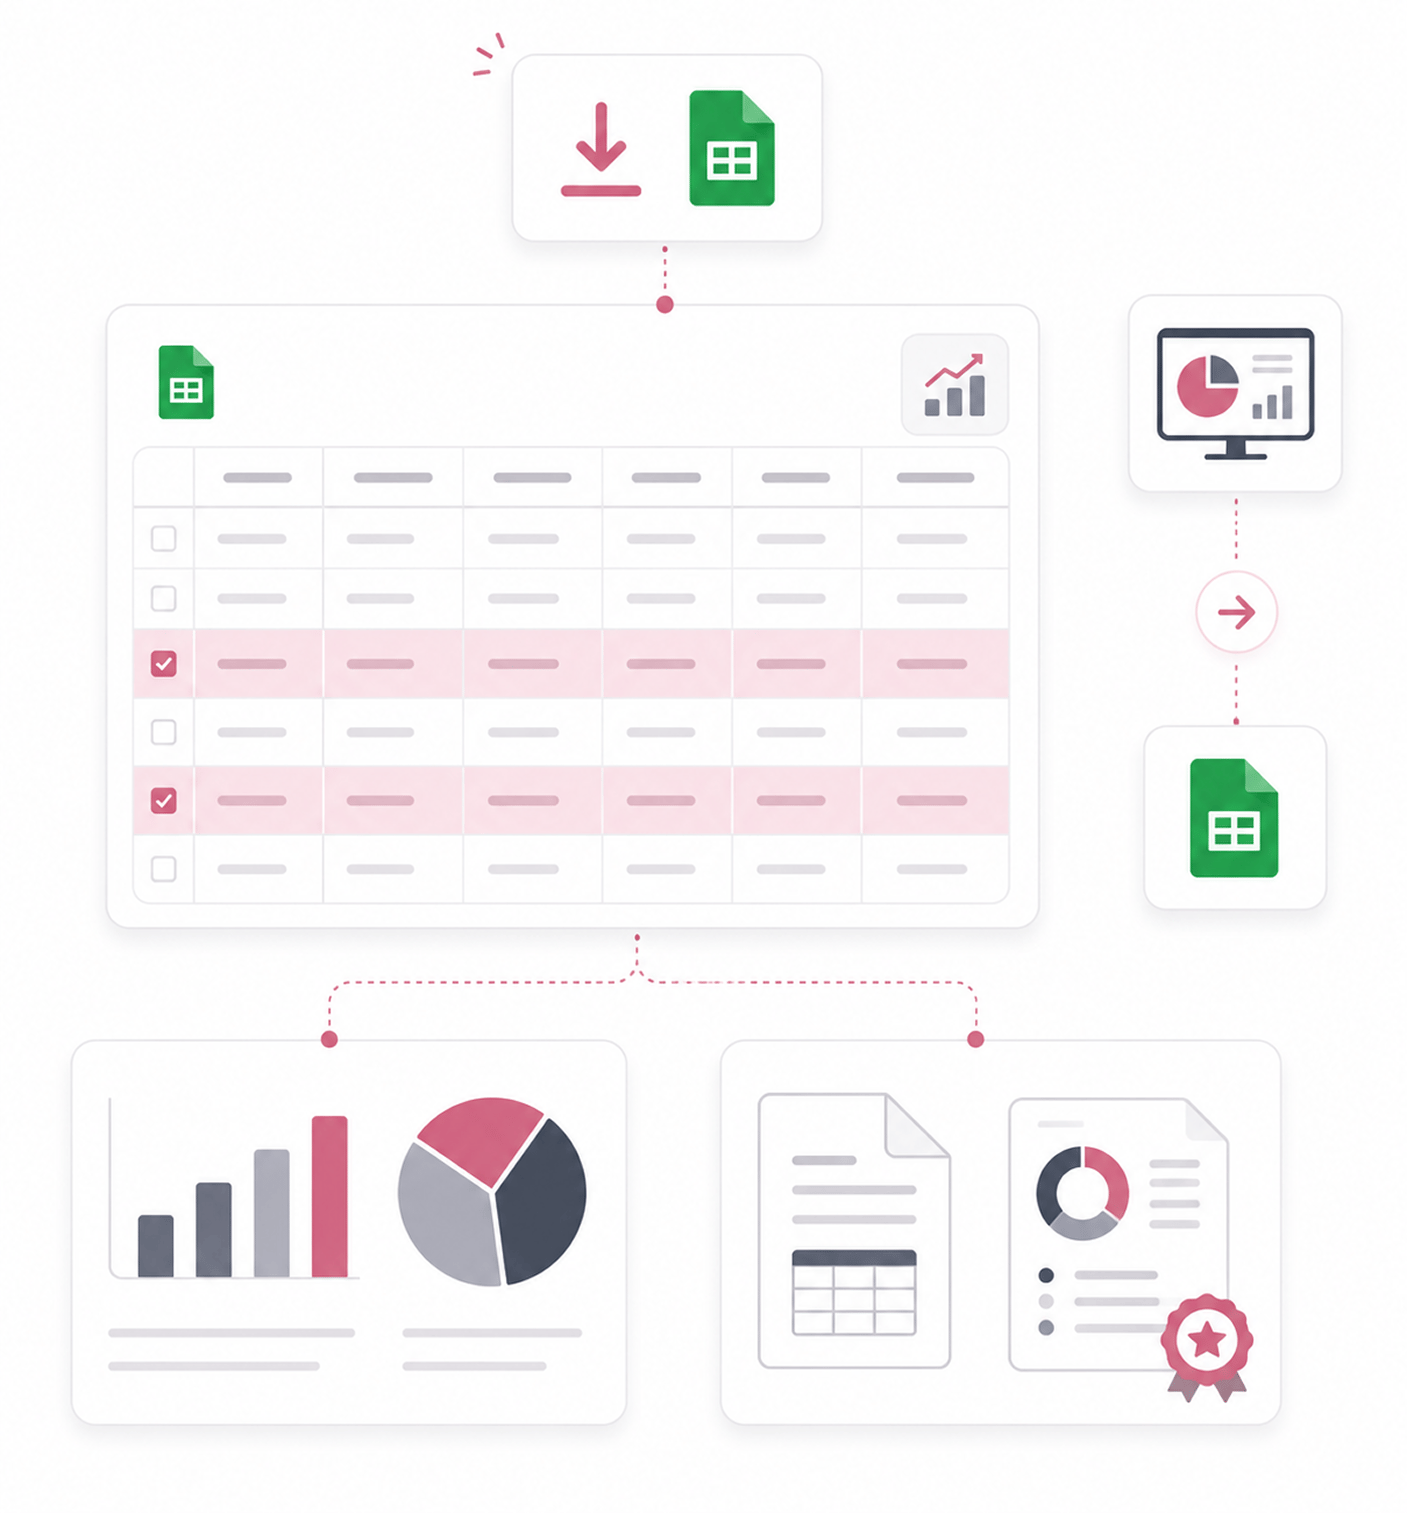
Live dashboard stats, filtered document reports, signing trends over 7, 30, and 90 days, top templates, activity logs, and export.
From dashboard glance to deep dive in 4 steps
Dashboard shows live stats, drill into document reports with filters, see trends and top templates, export to spreadsheet.
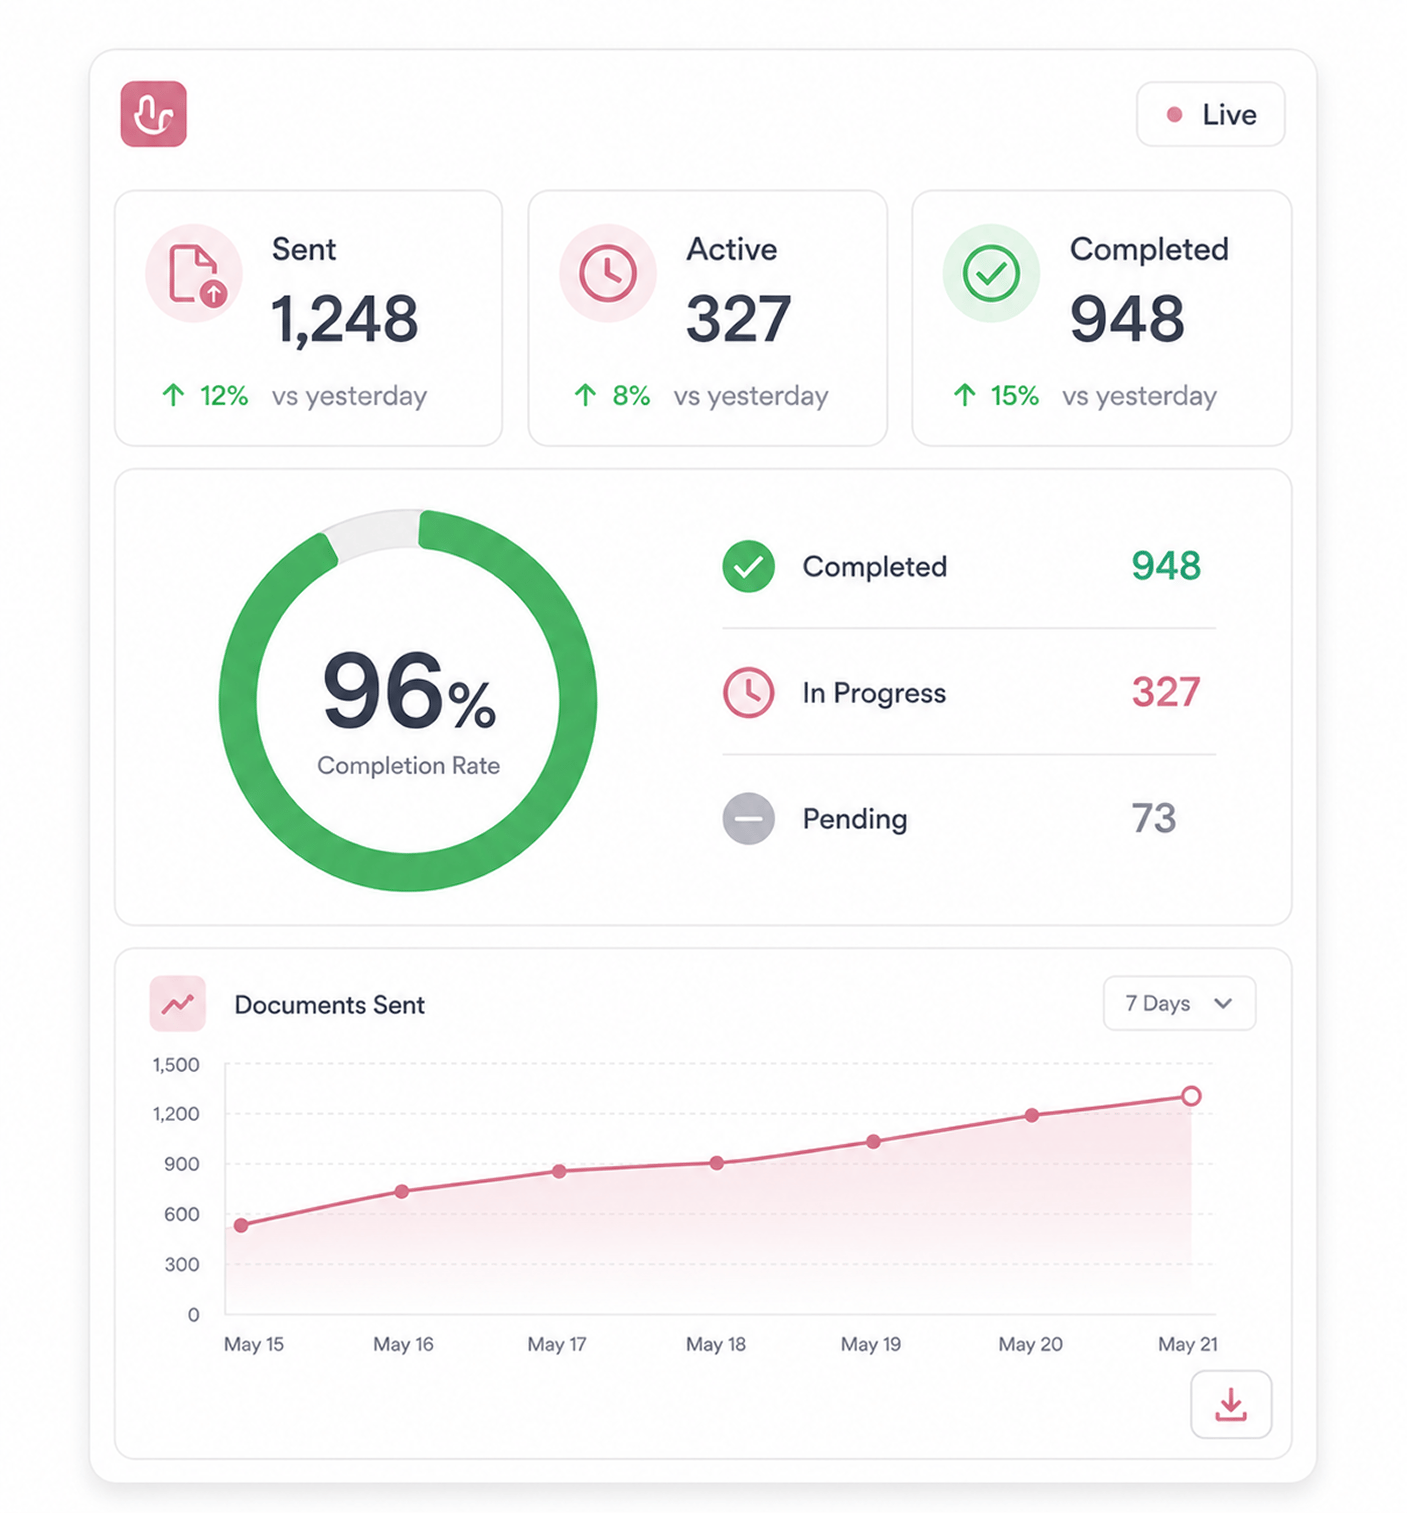
Live Stats
Dashboard shows live stats at a glance
Documents sent for signing, active deals, and overall completion rate appear the moment the team logs in. The numbers update in real time, so the picture is always current.
- Total Sent
- Active Deals
- Completion Rate
- Real Time
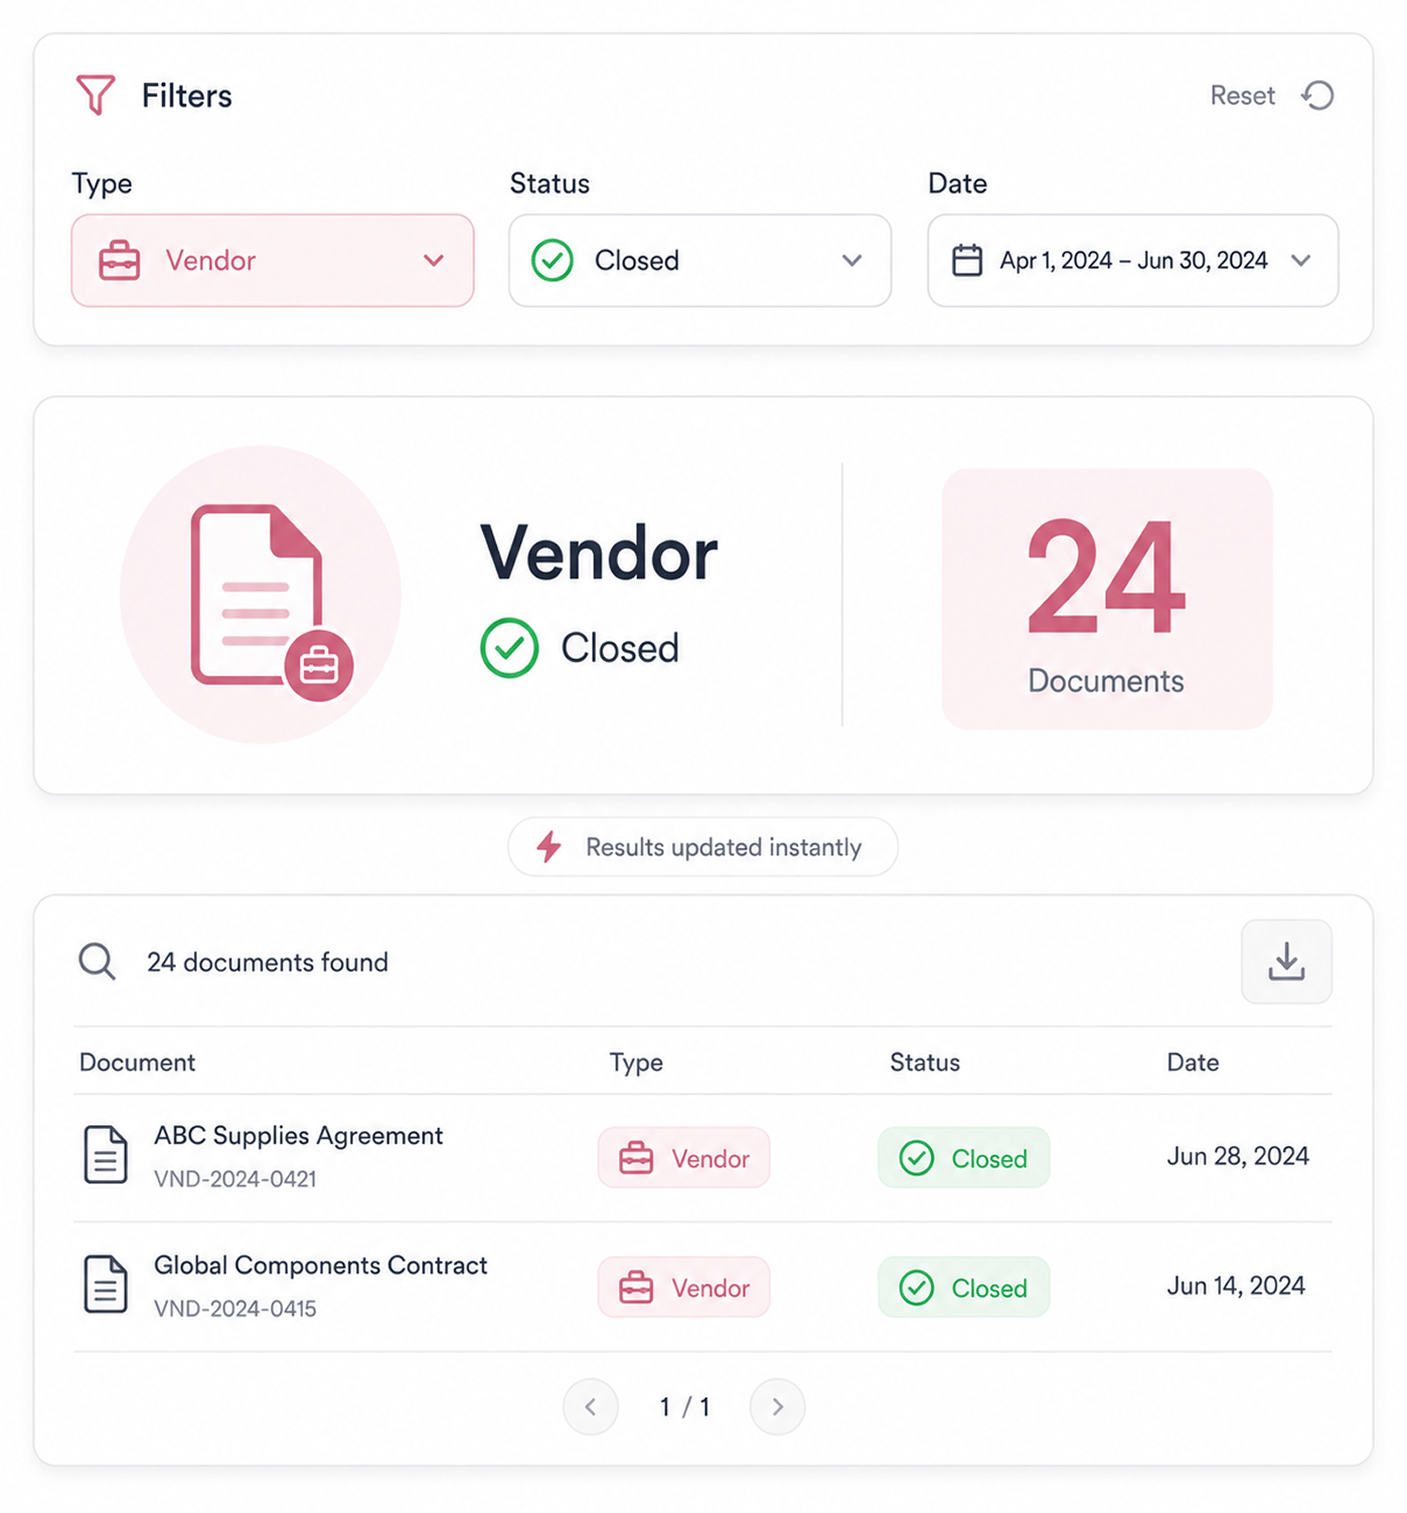
Filtered Reports
Drill into document reports with filters
Document reports let the team slice by contract type, signing status, date range, signer, template, and more. Whatever question comes up, the filters answer it without exporting first. Find how many vendor contracts closed last quarter in seconds.
- By Type · Status
- By Date · Signer
- By Template
- Quick Answers
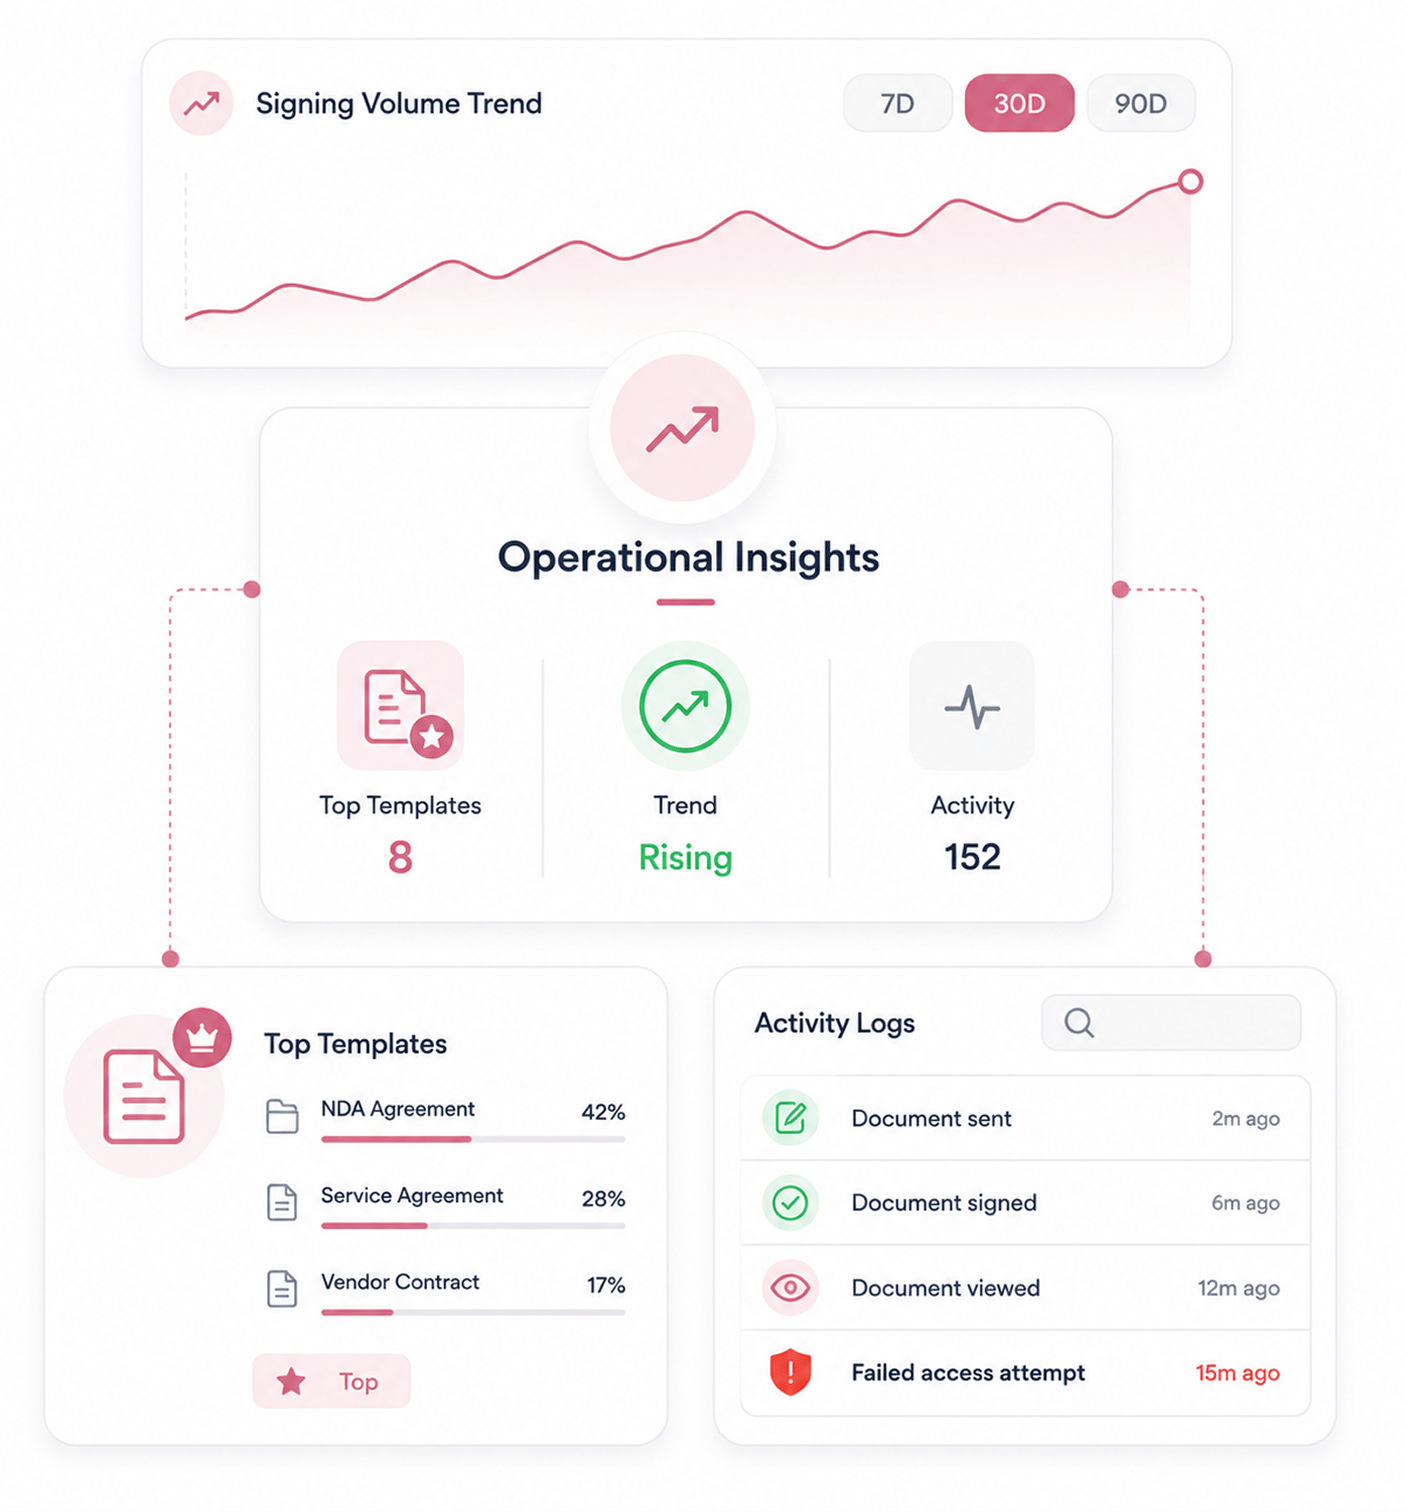
Trends And Logs
See trends, top templates, activity logs
Signing trends across 7, 30, and 90 day windows show whether the pace is rising or falling. Top templates reveal what the team relies on, and failed access tracking flags improper attempts.
- Volume Trends
- Top Templates
- Activity Logs
- Failed Access
Export Data
Export to spreadsheet for further analysis
Any report exports to a spreadsheet in one click. The team takes the data into the tools they already run for deeper analysis, board reporting, or finance reconciliation.
- One Click Export
- Spreadsheet Format
- Full Detail
- Take Anywhere
Six reasons signing operations actually become visible
Live dashboard stats, filtered reports, signing trends, top templates, and spreadsheet export.

Dashboard stats give the operational picture at a glance
Most teams have no idea what their signing operation looks like. Documents in flight and completion rate stay hidden. Live dashboard stats fix that.

Document reports with filters answer specific questions
How many contracts closed last quarter. Which agreements are still pending. Filters answer these questions in seconds, not manual counting.

Trend views surface signing velocity changes
A signing operation slowing down is worth knowing early. The 7, 30, and 90 day trend windows surface velocity changes early enough to address.

Top templates by usage show what the team actually runs
Teams think they know which templates matter, but usage data differs. Top templates by usage reveals the contracts the team actually depends on.

Failed access attempt tracking flags security concerns
Someone accessing contracts they should not is worth catching early. Failed access tracking surfaces these events automatically.

Spreadsheet export takes data wherever the team needs it
Some analysis happens elsewhere: board reports, finance reconciliation. Spreadsheet export takes any report into the tools you already use.
Dashboard stats give the operational picture at a glance
Most teams have no idea what their signing operation looks like. Documents in flight and completion rate stay hidden. Live dashboard stats fix that.
Document reports with filters answer specific questions
How many contracts closed last quarter. Which agreements are still pending. Filters answer these questions in seconds, not manual counting.
Trend views surface signing velocity changes
A signing operation slowing down is worth knowing early. The 7, 30, and 90 day trend windows surface velocity changes early enough to address.
Top templates by usage show what the team actually runs
Teams think they know which templates matter, but usage data differs. Top templates by usage reveals the contracts the team actually depends on.
Failed access attempt tracking flags security concerns
Someone accessing contracts they should not is worth catching early. Failed access tracking surfaces these events automatically.
Spreadsheet export takes data wherever the team needs it
Some analysis happens elsewhere: board reports, finance reconciliation. Spreadsheet export takes any report into the tools you already use.


10900+
Teams seeing signing operations clearly at every level
Built for teams who need to see signing operations at every level, from dashboard to deep dive
Operations teams needing visibility into what's in flight. Legal ops monitoring template usage. Sales ops tracking deal velocity. Compliance watching failed access. Founders needing board metrics.
Stats Live
Reports Filtered
Day Trends
Export Available
Dashboard stats, trends, top templates
Live dashboard stats show sent documents, active deals, and completion rate. Trend views across 7, 30, and 90 days surface velocity changes. Top templates by usage reveal what the team actually relies on day to day.
Everything the reports layer ships with
Live dashboard stats, filtered reports, signing trends, top templates, and export.

Live Dashboard Stats
Documents sent, active deals, and team completion rate appear on the dashboard in real time, the moment the team logs in.

Document Reports With Filters
Slice documents by contract type, status, date range, signer, and template. Operational questions get answered in seconds.

Signing Volume Trends
Trend views across 7, 30, and 90 day windows show whether the signing pace is rising or falling. Changes surface early.

Top Templates By Usage
See which templates run hundreds of times a quarter and which sit unused. Governance can focus on the contracts the team depends on.

Activity Logs With Search
Activity logs capture every action. Search finds events for audits. Failed access attempts are flagged automatically for security.

Spreadsheet Export
Any report exports to a spreadsheet in one click with full detail intact. The data flows into the tools the team already runs.
Everything you need to know
Questions about dashboard stats, filters, trends, access tracking, and export.
Sigi drafts, sends, and gets it signed without the chasing.
Turn a contract into a signed, audited document in minutes while AI flags risky clauses before they reach your signer.
- 5 min
- average time to signed
- 0
- risky clauses missed
- 100%
- documents with audit trail
- 6
- signing workflows supported